


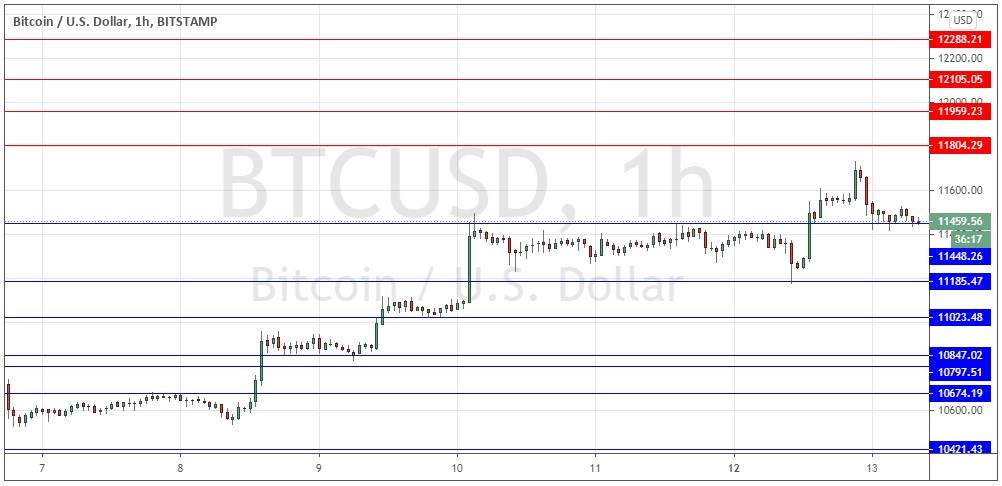
Yesterday’s signals produced a good, profitable long trade from the bullish inside bar break on the hourly chart which rejected the support level identified at $11,185. It may be wise to close the rest of this trade while it is still in a floating profit, especially if the new support level at $11,448 breaks down.
Today’s BTC/USD Signals
Risk 0.50% per trade.
Trades may only be taken prior to 5 pm Tokyo time Wednesday.
Long Trade Ideas
- Long entry after a bullish price action reversal on the H1 time frame following the next touch of $11,448, $11,185 or $11,023.
- Put the stop loss $50 below the local swing low.
- Adjust the stop loss to break even once the trade is $50 in profit by price.
- Remove 50% of the position as profit when the trade is $50 in profit by price and leave the remainder of the position to ride.
Short Trade Ideas
- Short entry after a bearish price action reversal on the H1 time frame following the next touch of $11,804, $11,959, or $12,105.
- Put the stop loss $50 above the local swing high.
- Adjust the stop loss to break even once the trade is $50 in profit by price.
- Remove 50% of the position as profit when the trade is $50 in profit by price and leave the remainder of the position to ride.
The best method to identify a classic “price action reversal” is for an hourly candle to close, such as a pin bar, a doji, an outside or even just an engulfing candle with a higher close. You can exploit these levels or zones by watching the price action that occurs at the given levels.
BTC/USD Analysis
I wrote yesterday that the bullish breakout beyond $11,023 has created a more bullish technical situation.
However, I noted a likely strong resistance level at $11,460 which was holding down the price.
I thought the best odds would be on the long side, so I was seeking a long trade from a bullish bounce at either $11,185 or $11,023.
This was a great call as I was correct about the price rising, and also correct about a long trade entry point from the bullish turn which rejected $11,185.
We see another bullish sign now with new higher stairstep support printing at $11,448. As long as this level holds, the outlook technically remains bullish.
The bullish case is also helped by the fact that the U.S. Dollar remains in a long-term bearish trend, although the U.S. Dollar is rarely the main driver of the price of Bitcoin in dollars.
I will maintain a cautiously bullish bias as long as the price holds above $11,448 – up to $11,804.
Concerning the USD, there will be a release of CPI (inflation) data at 1:30 pm London time.