


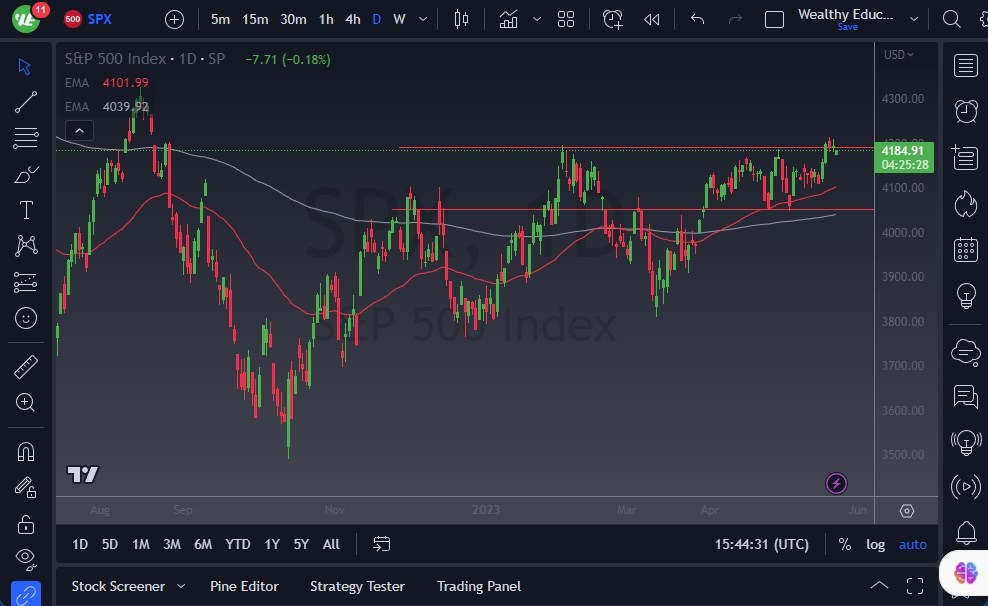
- The S&P 500 exhibited a modest pullback during Tuesday's trading session, close to the key psychological level of 4200.
- However, several factors continue to influence market sentiment, notably the ongoing debt ceiling issues in the United States.
- While the possibility of a US government debt default is highly unlikely, the political gamesmanship in Washington, DC, introduces significant volatility.
Additionally, market participants closely monitor inflation dynamics and the potential implications for monetary policy. There are indications that inflation may be cooling off, leading Wall Street to speculate that the Federal Reserve will initiate interest rate cuts later in the year. Nevertheless, the veracity of such claims remains to be seen. The Federal Reserve has explicitly stated its commitment to maintaining a tight monetary stance for an extended period. Some influential voting members of the Federal Reserve have even suggested the possibility of further interest rate hikes later in the year. As a result, the market is poised to experience significant momentum in both directions, leading to increased uncertainty regarding the overall trend.
Traders Should Remain Vigilant
Technically, the 50-Day EMA is situated around the 4100 level and is ascending, providing dynamic support for the market. In the event of a pullback from current levels, a short-term corrective phase could be anticipated. However, a major market collapse seems unlikely, as Wall Street actively strives to resist the Federal Reserve's tightening measures. On the other hand, a decisive breakout above the 4200 level would likely propel the index towards 4300, potentially setting the stage for a "buy-and-hold" scenario. The realization of this scenario remains uncertain, but it is one of the possibilities that traders should bear in mind.
In conclusion, the S&P 500 demonstrated a small pullback as it approached the significant resistance level 4200. The market continues to grapple with debt ceiling concerns and their potential impact on volatility. Moreover, inflation dynamics play a pivotal role in shaping market sentiment and the outlook for monetary policy. The Federal Reserve's commitment to maintaining a tight stance contributes to significant momentum and raises questions about the overall trend. The 50-Day EMA provides dynamic support near the 4100 level, while a breakout above 4200 could lead to further gains. Traders should remain vigilant and adapt their strategies accordingly in the face of evolving market dynamics.
 Ready to trade the S&P 500 Forex? We’ve shortlisted the best Forex brokers for CFD trading in the industry for you.