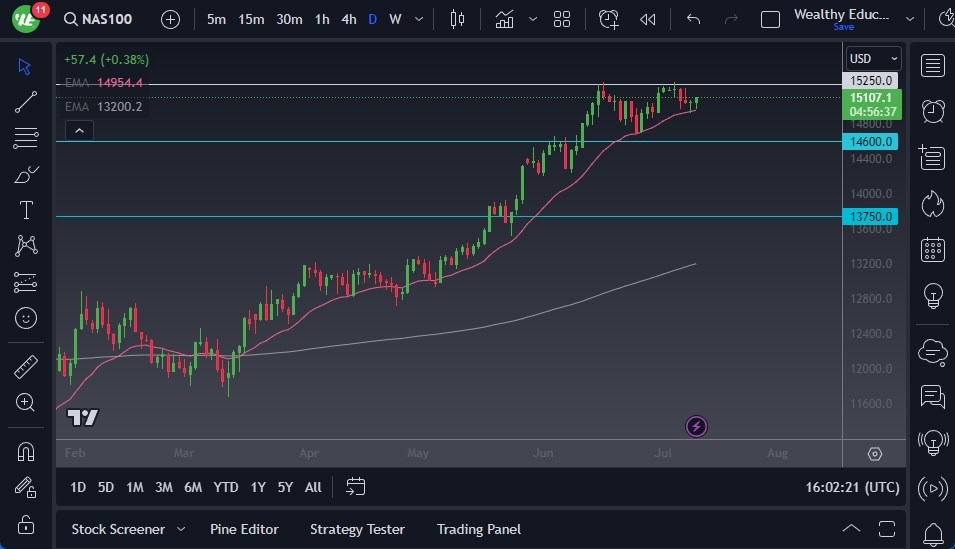
The NASDAQ 100 initially pulled back just a bit during the trading session on Tuesday, testing the 50-Day EMA. At this point, the market looks as if it is going to pay close attention to the 15,000 level, which of course is a large, round, psychologically significant figure. Beyond that, we also have to keep in mind that the market has formed to hammers in a row, so that also suggests bullish pressure.
Top Regulated Brokers
After that, you can also make an argument that we are in the midst of an ascending triangle, and that of course is a very bullish sign and most technical traders will continue to look at it as such. With that in mind, I think is probably only a matter of time before we see an attempt to break above the crucial 15,250 level, which would send quite a bit of “FOMO trading” into the market, perhaps opening up the possibility of a move to the 15,500 level.
Looking at this chart, the 50-Day EMA is obviously supportive, but at this point in time I think you have to think that if we were to break down below there, then the 14,600 level is an area where a lot of people can thousand 600 level has been supportive more than once, but ultimately it was more or less an area of “market memory”, because we had seen sellers in that same area.
The NASDAQ 100 is driven by about 7 or 8 stocks, most of which are the ones you already know like Tesla, Microsoft, Adobe, etc. Because of this, the market is likely to continue to move in lock step with those names going forward, which obviously makes quite a bit of sense as it is not an equal weighted index, despite the fact that they had to re-weight the index just yesterday as they had become over 40% of the total market capitalization. This shows a lot of concentration, so if the big-name start to give way, that is going to drag this index quite a bit lower in short order. On one hand, it’s essentially the same thing is trading a small ETF, but at the other hand, you have to worry about whether or not some of these big companies start to struggle. If the “AI narrative” becomes unraveled, that could be disastrous.
Ready to trade our NASDAQ 100 forecast? Here’s a list of some of the best CFD brokers to check out.