


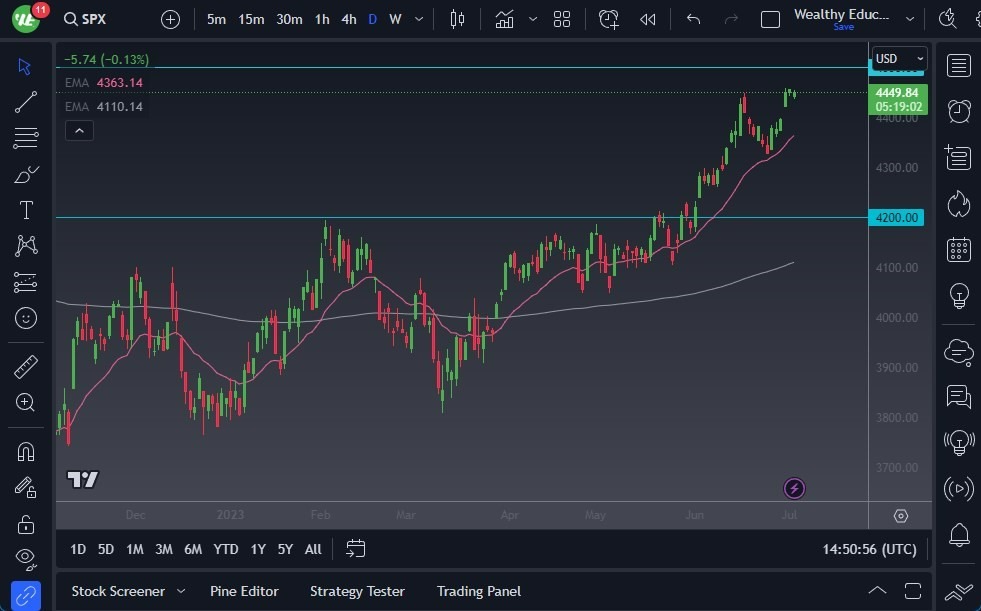
- The S&P 500 experienced a slight pullback during Wednesday's trading session as it encountered significant resistance near the 4500 level.
- Consequently, the market is now seeking potential buyers at lower levels, offering potential value on a pullback.
- Key support levels to watch include 4400 and even as low as 4300, where the 50-Day Exponential Moving Average (EMA) comes into play.
Top Regulated Brokers
S&P 500 Technical Outlook Today
Considering the long-standing bullish trend in the market, a minor pullback seems reasonable. Traders must assess whether the pullback offers sufficient value. The rising 50-Day EMA serves as a support level, and as long as prices remain above it, a continuation of the S&P 500's rally can be expected. However, a breakdown below the 50-Day EMA could prompt the market to target the 4200 level, potentially even the 200-Day EMA.
Alternatively, if prices reverse and break above the 4500 level, the S&P 500 could rally towards the 4600 level and potentially beyond. This would signal the initiation of the next upward leg. A daily close above 4500 would likely attract additional capital flow into the market, leading to momentum chasing by traders.
The S&P 500 remains a highly volatile and noisy market. However, due to the strong momentum observed, shorting the market does not seem advisable. It is important to note that the S&P 500 is driven by a handful of stocks, making it crucial for traders to focus on the performance of these major stocks. As an unequal weighted index, the S&P 500 does not reflect the performance of all 500 stocks. Instead, it primarily represents the top eight or ten stocks.
Ultimately, the S&P 500 encountered significant resistance near the 4500 level, resulting in a slight pullback. This pullback presents a potential buying opportunity, with key support levels to monitor at 4400 and 4300, coinciding with the 50-Day EMA. The market's long-standing bullish trend suggests that a minor pullback is to be expected. A daily close above 4500 would likely lead to increased market inflows and momentum chasing. It is important to exercise caution due to the inherent noise in the market and focus on the performance of the major stocks driving the S&P 500. While the market remains noisy, shorting the S&P 500 is not recommended given its strong momentum. Traders should stay attentive to the movement of the market and assess whether pullbacks offer sufficient value before making trading decisions.
Ready to trade our S&P 500 analysis? Here’s a list of some of the best CFD trading brokers to check out.