


- The NASDAQ 100 has fallen during the session on Wednesday, as we continue to see a lot of negativities in this market.
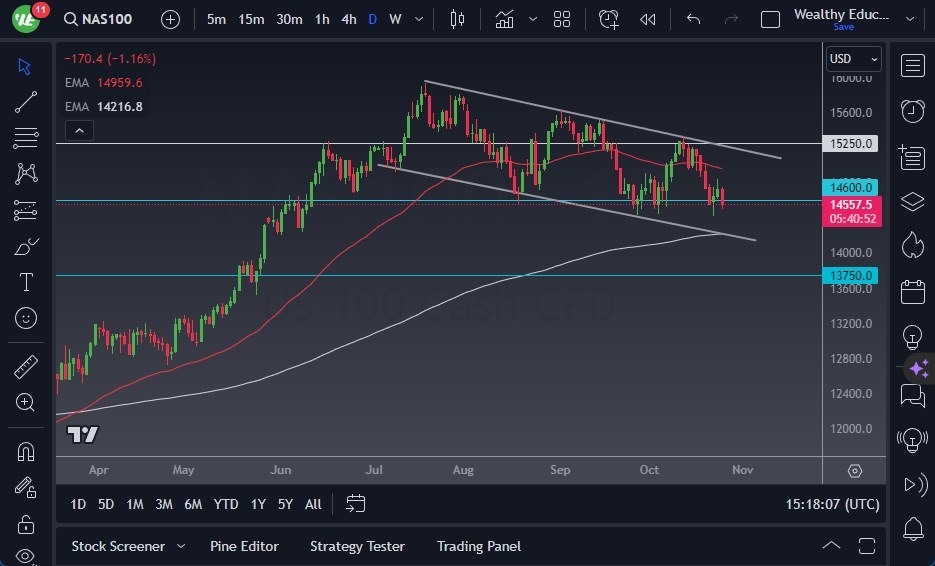
- The 14,500 level suggests a certain amount of support, and we have seen the market hang around this area multiple times.
- The most recent rally has been a bit limp, and it suggests that the market is going to continue to see a lot of downward pressure.
Top Regulated Brokers
The fact that the most recent high was much lower than the ones before it does suggest that perhaps traders are really starting to become concerned, and a drive down to the 200-day EMA is very possible. Breaking down below the bottom of the hammer from the Monday session, then it opens up an attempt on the 200-Day EMA itself. If we were to break down below there, then the market is likely to go much lower, perhaps reaching toward the 13,750 level.
On the other side of the trade, if we were to break above the top of the shooting star from the Tuesday session, it suggests that the market could investigate the 50-day EMA. Keep in mind that the market breaking above the top of the 50-day EMA would take a significant amount of momentum, but we are during Q3 earnings, so that does make a certain amount of sense that the market will continue to see violent moves. However, we also have other things to worry about, not the least of which will be the interest rate situation in the United States that stays very strong.
Looking to Fade on Short-term Rallies
After that, we also have the geopolitical concerns that will come into the picture as well, not the least of which of course will be the Israeli/Hamas war. If that does in fact expand at this point, that could probably send stock markets around the world much lower, and of course, the NASDAQ 100 won’t be spared this downward pressure.
When I look at the longer-term chart, it’s easy to see that we are in a down-trending channel, so a breakdown makes more sense than not at this point. Furthermore, it seems like the sellers are extraordinarily aggressive.
In conclusion, I suspect that this market is one that you continue to fade on short-term rallies, but keep in mind that with all of the external factors out there, it’s going to be difficult to hang on to any position at the moment. The NASDAQ 100 of course is much more volatile than other indices in the United States, so maybe the first one to get hammered.
Ready to trade our NASDAQ 100 forecast? Here’s a list of some of the best CFD trading brokers to check out.