


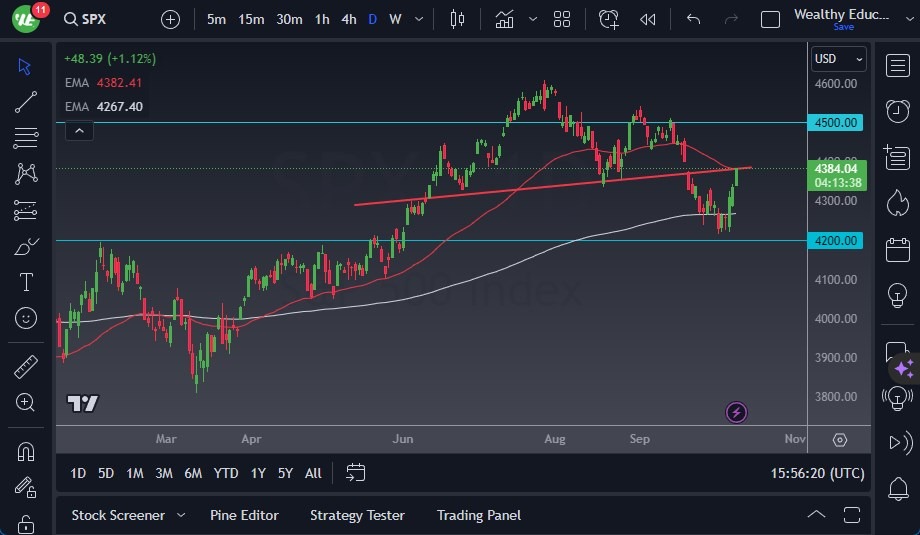
- The S&P 500 currently finds itself perched just below a critical resistance level, in close proximity to the 50-Day Exponential Moving Average.
- The key differentiator between Tuesday's session and Monday's is the reopening of the bond market, a development that has the potential to significantly impact market dynamics.
- As we assess the situation, a rise in yields could exert pressure on stock values, possibly leading to a market pullback. However, such a retreat does not necessarily signify a breakdown; instead, it could signal a return to the previous consolidation range spanning from the current level to the 50% Fibonacci retracement level, situated just below the 200-Day EMA.
Top Regulated Brokers
In essence, the market is primed for a period of heightened volatility, particularly as it teeters between the 50-Day EMA and the 200-Day EMA, a configuration known to create a "squeeze" effect. Consequently, it is prudent to exercise caution in anticipation of increased market turbulence. It's worth noting that the prevailing sentiment suggests that volatility is more likely to intensify rather than abate.
A potential breakout above the 50-day EMA could propel the market toward the 4500 level or even higher. Conversely, a downturn below the 50% Fibonacci level, which also corresponds to the recent low, would likely set the stage for a move toward the 61.8% Fibonacci level, and potentially even lower. In this context, the S&P 500 appears poised for a continued back-and-forth pattern, underscoring the importance of caution and astute risk management.
Inflation Continues Being Relevant
Furthermore, the market's trajectory remains intrinsically linked to interest rates in the United States. Monitoring the 10-year Treasury yield is a valuable tool for anticipating the market's direction. As long as concerns surrounding inflation persist, it is expected to remain the predominant narrative on Wall Street. This “groupthink” seems to be in full effect at the moment, so be careful.
In the end, the S&P 500 confronts a pivotal juncture, testing key resistance levels while contending with the reopening of the bond market. Heightened volatility is anticipated in the days ahead, necessitating a cautious approach for investors. The direction of interest rates, particularly the 10-year yield in the US, will play a central role in guiding market sentiment. The overarching theme of inflation will continue to dominate discussions on Wall Street as market participants navigate these dynamic conditions.
 Ready to trade the S&P 500 Forex? We’ve shortlisted the best Forex brokers for CFD trading in the industry for you.