


- Ignoring gravity, the S&P500 showed a lot of upward pressure on Monday.
- The market had no economic releases to be concerned about.
S&P 500
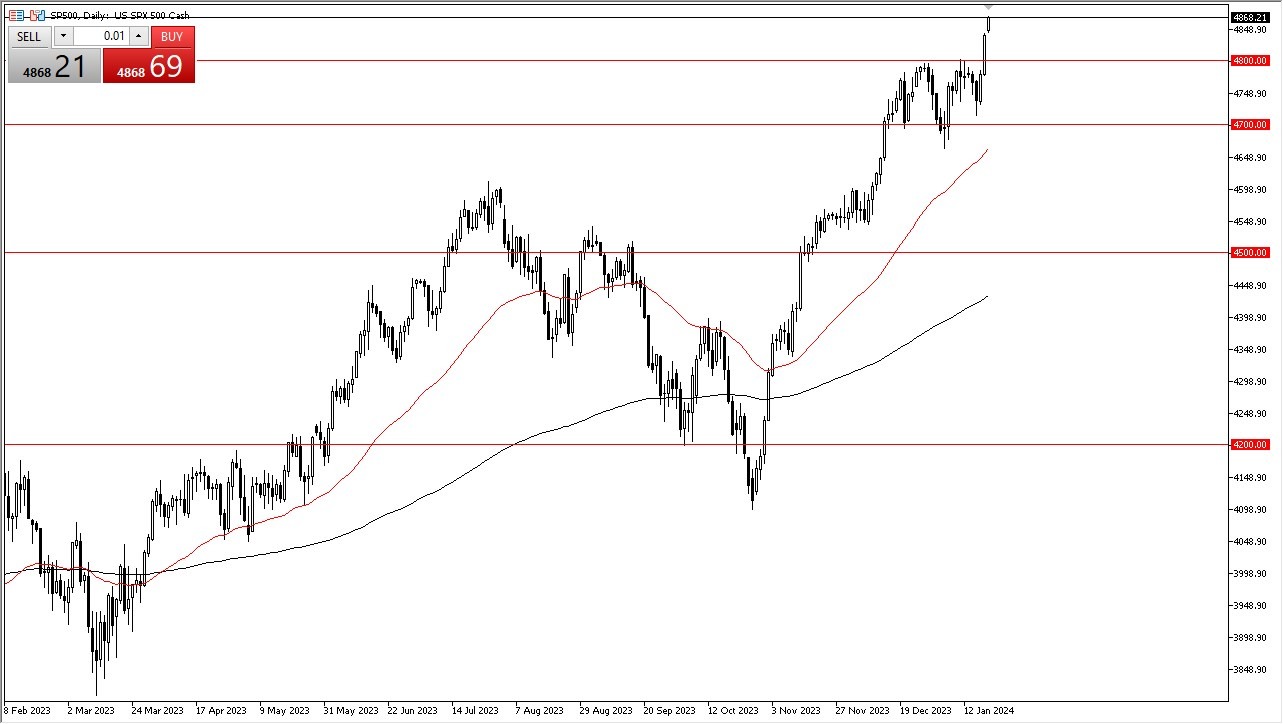
This has now rallied with the S&P 500 initially during Mondays trade. In this situation, all factors being equal, I think traders will continue to view short-term pullbacks as opportunities for purchase because breaking through its 4,800 level means it is now regarded as one of the major support levels. It is all about whether or not the Federal Reserve should cut interest rates at this point, and we are still in that Goldilocks moment where everything is right. That may not be true at all; however, Wall Street seems far from being interested in shorting anything at the moment. And if so, then you have to consider this as a market that cannot be sold either.
Value can still be found in short-term pullbacks. We want to reach 4900 fairly soon. Another likely target could also be 5000. This being said, what you would notice is that traders will continue to watch every retracement anticipating another chance to buy and hence this is how trading should be done. Position sizing is always an issue but currently there appears so much momentum that it might result into a lot of FOMO chasing which needs watching out for. Underneath I see the 4700 level as the floor in the market that also features the 50 day EMA, so that of course is something worth paying attention to. Lastly, I feel we must find excuses to turn bullish.
Top Regulated Brokers
Shorter-term charts may show the way
Maybe look towards shorter term charts so something like a half hour chart or perhaps a quarter hour chart above you are probably going to find tons of buying pressure here. 5,000 will certainly slow things down quite a bit but right now it looks like it just keeps moving along steadily for more upside gains before any significant downturn happens. At the moment it’s looking incredibly bullish, and I think that you will continue to see more money thrown into the stock market as fear is almost non-existent in the short term. Generally, hubris comes before the fall, but right now it looks like that is being completely ignored.
Ready to trade our S&P 500 daily forecast? Here are the best CFD brokers to choose from.