


- The NASDAQ 100 had a difficult Tuesday, and at first it appeared like Wednesday would be more of the same, but things have turned around and are starting to show signs of life.
- In the end, it appears that the NASDAQ 100 will continue to rise significantly.
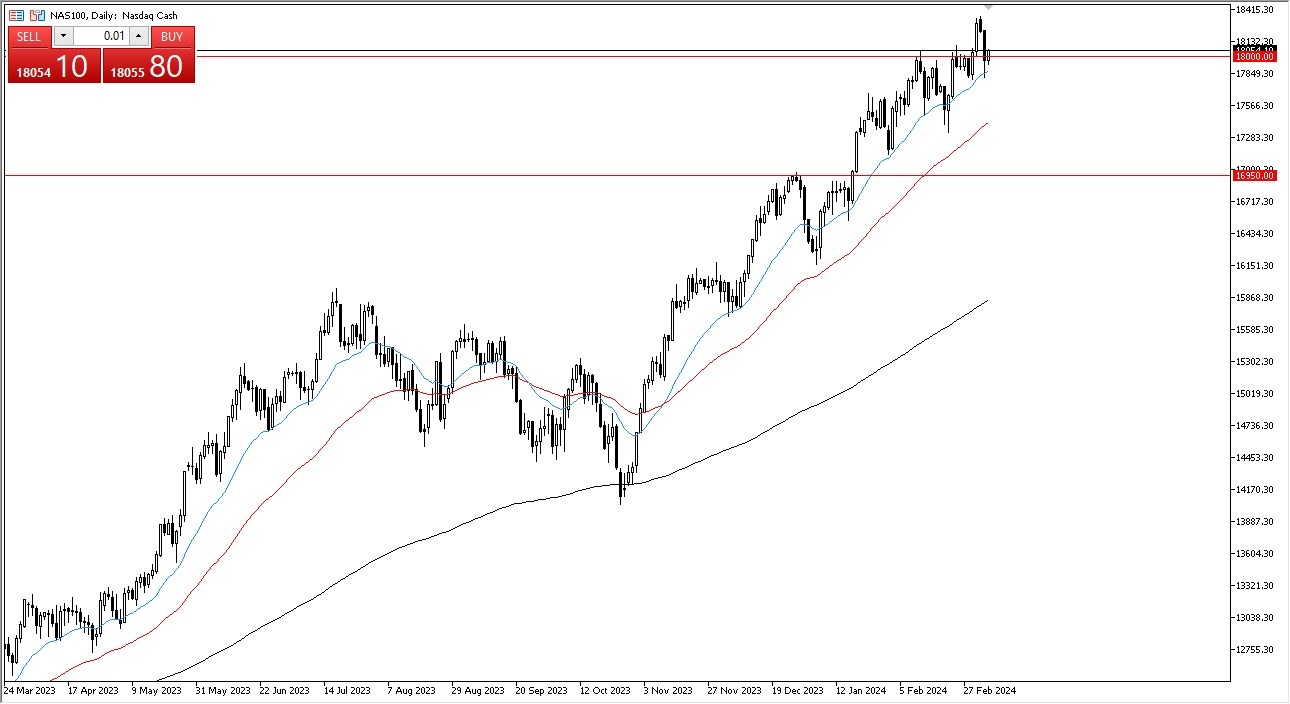
NASDAQ 100 Recovers on Wednesday?
As you can see, the $18,000 level appears to be providing some degree of support for the NASDAQ 100, which led to a small rally during Wednesday's trading session in the early hours. Given this, I believe the NASDAQ 100 will continue to have strong upward momentum in the future.
Even though there was a lot of selling during the Tuesday session, the market has generally been in a strong uptrend, and it doesn't appear that this has changed. When trading this market, it all boils down to basic trend following because the 20-day EMA has also presented a barrier. Recall that a small number of stocks will determine the performance of the NASDAQ 100, so long as the so-called Magnificent Seven are performing well, the NASDAQ 100 will too. We have been experiencing this correlation for a considerable amount of time.
Top Regulated Brokers
I believe that this market will reach the $20,000 mark in due course, but we lack the momentum to see that through to completion. This is normal uptrend behavior, so nothing to worry about. The chart shows that the trend is perfectly angled at a 45-degree angle. As a result, I consider every dip we experienced during the Tuesday session to be a possible opportunity to buy, and it seems that most investors share this sentiment.
The 50-day EMA may provide support even if we break below the 20-day EMA, and the $16,950 level will undoubtedly be the reason for this because it has historically been such strong resistance. Because there isn't a single indication on this chart to the contrary, I'm a buyer on dips and I think we still have some way to go. As a result, I believe that the market will continue to see a lot of people "buying on the dip."
Ready to trade the NASDAQ? We’ve made a list of the best online CFD trading brokers worth trading with.