
My previous BTC/USD signal on 2nd February was not triggered.
Today’s BTC/USD Signals
- Risk 0.50% per trade.
- Trades must be taken prior to 5pm Tokyo time Tuesday.
Long Trade Ideas
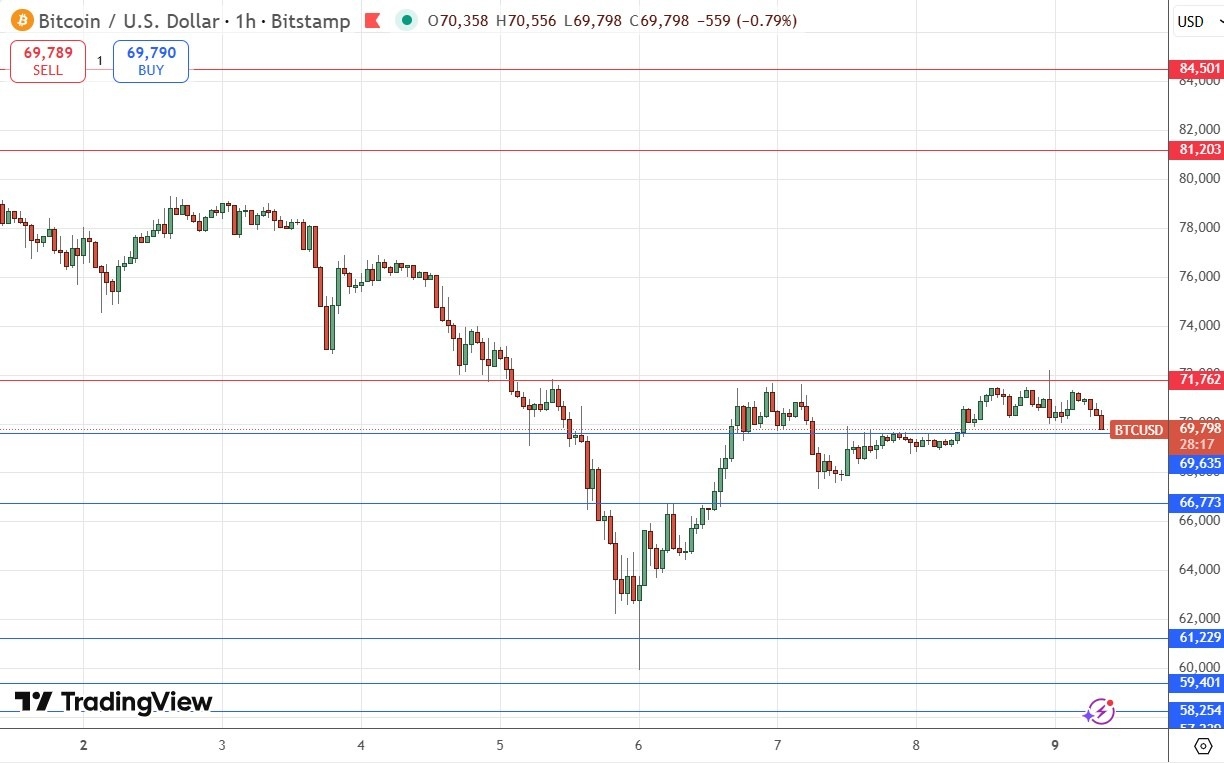
- Long entry after a bullish price action reversal on the H1 timeframe following the next touch of $69,635, $66,725, $61,229, or $59,401.
- Put the stop loss $100 below the local swing low.
- Move the stop loss to break even once the trade is $100 in profit by price.
- Remove 50% of the position as profit when the trade is $100 in profit by price and leave the remainder of the position to run.
Short Trade Ideas
- Short entry after a bullish price action reversal on the H1 timeframe following the next touch of $71,762, $81,203, or $84,501.
- Put the stop loss $100 above the local swing high.
- Move the stop loss to break even once the trade is $100 in profit by price.
- Remove 50% of the position as profit when the trade is $100 in profit by price and leave the remainder of the position to run.
The best method to identify a classic “price action reversal” is for an hourly candle to close, such as a pin bar, a doji, an outside or even just an engulfing candle with a higher close. You can exploit these levels or zones by watching the price action that occurs at the given levels.
BTC/USD Analysis
In my last BTC/USD forecast exactly one week ago, I thought that the outlook was bearish. I was correct about this, as the price continued to fall and eventually reach a new 16-month low at about $60,000.
The price made a V-shaped bounce from the low at $60,000 which is a somewhat bullish sign, but the rise has run out of momentum, with the resistance level at $71,762 firmly containing the price.
This level looks likely to be pivotal and decisive.
We have a long-term bearish trend.
If the resistance at $71,762 holds and survives a test, this could be a good short trade entry, but the price action near $60,000 suggests that this bottom will hold for some time.
If the price action gets established above $71,762 that will present a more bullish picture, but even here, I would continue looking for a short trade entry.
I am bearish, but I do recognise that just when you think Bitcoin is about to really fall, long-term buyers have tended to step in. Yet I wonder whether this is still going to be the case now Bitcoin has lost more than half of its value in only.
There is nothing of high importance due today regarding either Bitcoin or the US Dollar.
Ready to trade our daily Forex signals? Here is our list of the best MT4 crypto brokers worth reviewing.