
Bearish view
Sell the BTC/USD pair and set a take-profit at 60,000.
Add a stop-loss at 73,000.
Timeline: 1-2 days.
Bullish view
Buy the BTC/USD pair and set a take-profit at 73,000.
Add a stop-loss at 60,000.
The BTC/USD pair wavered as geopolitical concerns escalated. Bitcoin price was trading at $66,915 on Monday morning, higher than the year-to-date low of $66,000 and much lower than the all-time high of $126,300.
Bitcoin Price on Edge as Safe-Haven Roll Tested
The BTC/USD pair remained on edge as Bitcoin’s role as a safe-haven asset was tested again. This happened as the United States and Israel launched a joint attack on Iran, killing its supreme leader.
Gold has emerged as a better safe-haven asset as evidenced by its ongoing rally and ETF inflows. This rally continued on Monday as it remained above the key support level at $5,000.
Bitcoin had a difficult performance in February when it erased all gains made in January and slumped to the year-to-date low of $60,000. It then rebounded and consolidated between $60,000 and $70,000.
The BTC/USD pair wavered as exchange-traded funds (ETF) outflows continued for the fourth consecutive months. These funds shed over $206 million in February after losing $1.6 billion in January.
These funds have shed over $6 billion in the last four consecutive months, bringing the cumulative net inflows since inception to over $54 billion. Their net assets stand at over $83 billion. In contrast, the SPDR Gold Shares ETF (GLD) has added billions of dollars in assets this year as it emerged as a better safe-haven asset.
The main driver for the Bitcoin price will be the developments in Iran and the Middle East. Signs that the war is escalating will lead to lower prices as energy costs jump, leading to inflation concerns. On the other hand, signs of off-ramps will be bullish for Bitcoin and other cryptocurrencies.
Meanwhile, the US will publish the next non-farm payrolls data on Friday, shedding more color on the labor market.
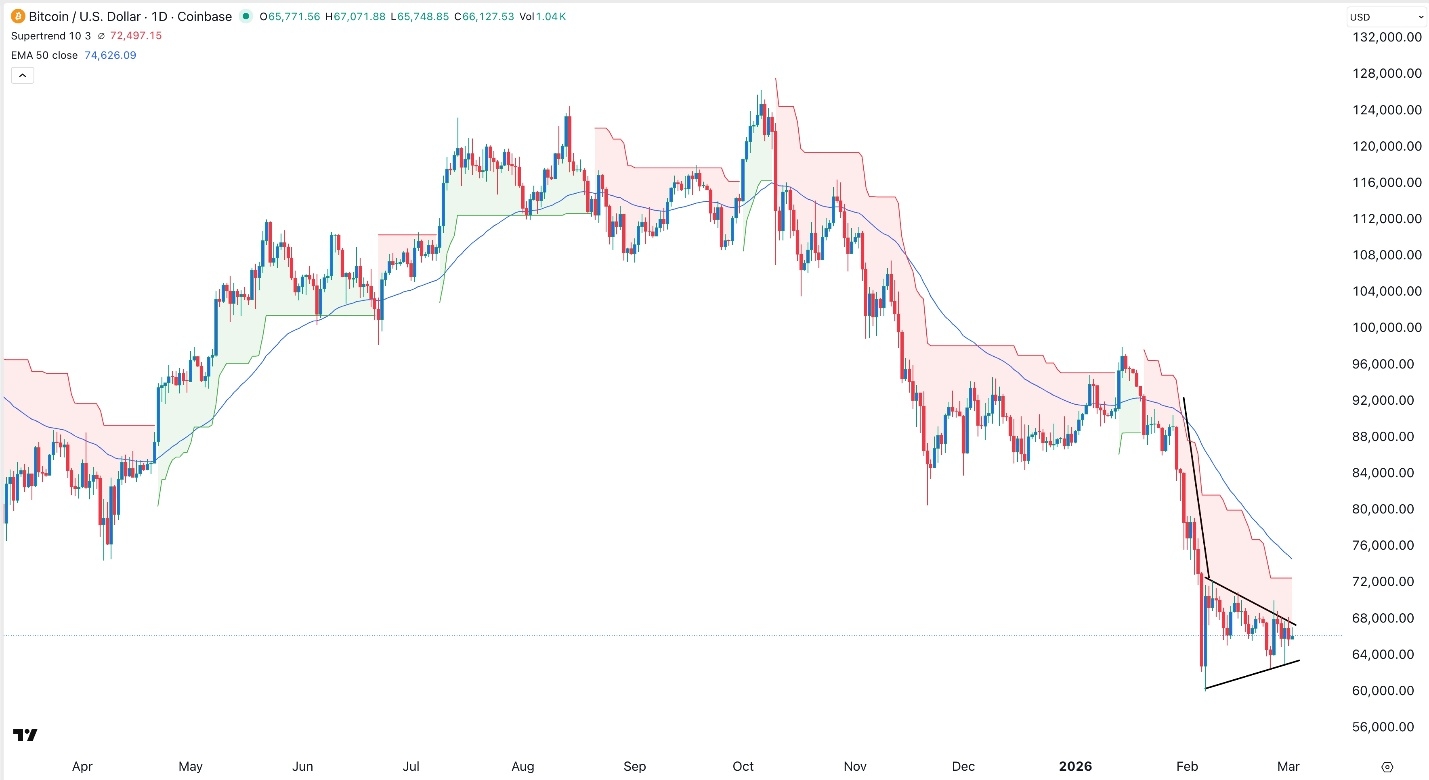
BTC/USD Technical Analysis
The daily timeframe chart shows that the BTC/USD pair has slumped in the past few months. It slumped from a high of 126,300 in October last year to 67,000 as ETF outflows continued and futures open interest dropped.
The coin has slumped below the key support level at 80,130, its lowest level in November last year. It has also remained below all moving averages and the Supertrend indicator.
Bitcoin has also formed a bearish pennant pattern, which is made up of a vertical line and a symmetrical triangle. Therefore, while the coin will be highly volatile, there is a likelihood that it will have a bearish breakout in the near term.