
My previous BTC/USD signal last Monday produced a breakeven short trade from the bearish inside candlestick which rejected the resistance level at $70,870.
Today’s BTC/USD Signals
Risk 0.50% per trade.
Trades must be taken prior to 5pm Tokyo time Friday.
Long Trade Ideas
Go long after a bullish price action reversal on the H1 timeframe following the next touch of $69,541, $68,890, or $67,332.
Place the stop loss $100 below the local swing low.
Move the stop loss to break even once the trade is $100 in profit by price.
Take off 50% of the position as profit when the trade is $100 in profit by price and leave the remainder of the position to ride.
Short Trade Ideas
Go short after a bullish price action reversal on the H1 timeframe following the next touch of $72,034 or $72,907.
Place the stop loss $100 above the local swing high.
Adjust the stop loss to break even once the trade is $100 in profit by price.
Take off 50% of the position as profit when the trade is $100 in profit by price and leave the remainder of the position to ride.
The best method to identify a classic “price action reversal” is for an hourly candle to close, such as a pin bar, a doji, an outside or even just an engulfing candle with a higher close. You can exploit these levels or zones by watching the price action that occurs at the given levels.
BTC/USD Analysis
In my last BTC/USD forecast last Monday, I thought that the best trade which might set up would be a short trade at $69,541 as it was confluent both with the upper trend line of the descending price channel and the big round number at $70,000.
This was not a good call, as the reversal happened higher than that.
I did think if the price got above $70k then predicting the price action to come would be messy, and I think I was right about that.
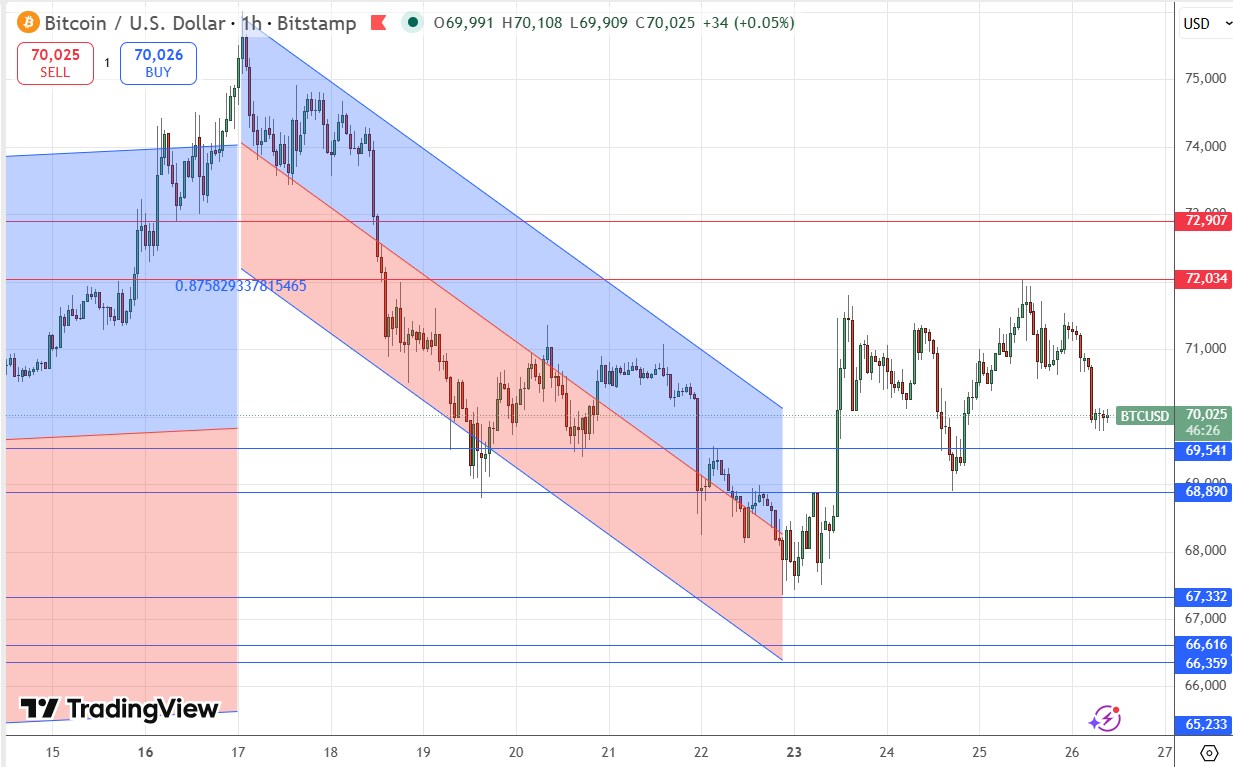
Bulls and bears are quite evenly matched, although there is bearish momentum over the short-term, in line with the long-term trend. You could say that the medium trend is weakly bullish, as the price is still contained within an ascending linear regression analysis price channel which is presented within the price chart below.
I think the best trade which might set up today will be a long trade from a bullish bounce off the support level at $68,690.
The resistance level at $72,034 also looks strong.
As bulls and bears are so evenly matched, it might be possible to take at least a scalp off any rejection of any support or resistance level.
One technical feature that stands out in today’s chart to watch for the future, is how much room bulls would have to push the price higher if the price gets established above $73,072.
https://www.tradingview.com/chart?symbol=COINBASE%3ABTCUSD
There is nothing of high importance due today regarding Bitcoin. Concerning the US Dollar, there will be a release of Unemployment Claims at 12:30 London time.
Ready to trade our free Forex signals? Here is our list of the best MT4 crypto brokers worth checking out.