
Bearish view
Sell the GBP/USD pair and set a take-profit at 1.3300.
Add a stop-loss at 1.3550.
Timeline: 1-3 days.
Bullish view
Buy the GBP/USD pair and set a take-profit at 1.3550.
Add a stop-loss at 1.3300.
The GBP/USD pair rose slightly as traders reacted to the latest US jobs numbers, which showed that the labor market was facing substantial strains. It was trading at 1.3410, up substantially from this month's low of 1.3256.
US Consumer Inflation Report
The GBP/USD exchange rate rose slightly as market participants reacted to the weak macro data from the United States. A report by the Bureau of Labor Statistics (BLS) showed that the economy lost over 92,000 jobs, the worst figure since 2022.
The unemployment rate rose to 4.4%, meaning that the situation is getting worse as top companies like Amazon and Target slash jobs in the country. A separate report released on Wednesday showed that the private sector created 68,000 jobs in February.
Meanwhile, data released by the Commerce Department showed that the country’s retail sales dropped in January, a sign that the economic weakness continued.
The next important catalyst for the GBP/USD pair will be the upcoming US consumer inflation report on Wednesday. Economists see the headline inflation rose to 2.4% in February, while the core inflation rose 2.5%. Still, inflation will likely continue rising as the war in Iran continues.
Crude oil prices have soared by over 50% this year, while natural gas soared by 11% in the last seven days. Also, gasoline and heating oil prices have jumped by over 61% and 70% this year.
The US will then publish the latest existing home sales report on Tuesday. Economists expect the data to reveal that home sales dropped from 3.91 million in January to 3.90 million in February.
GBP/USD Technical Analysis
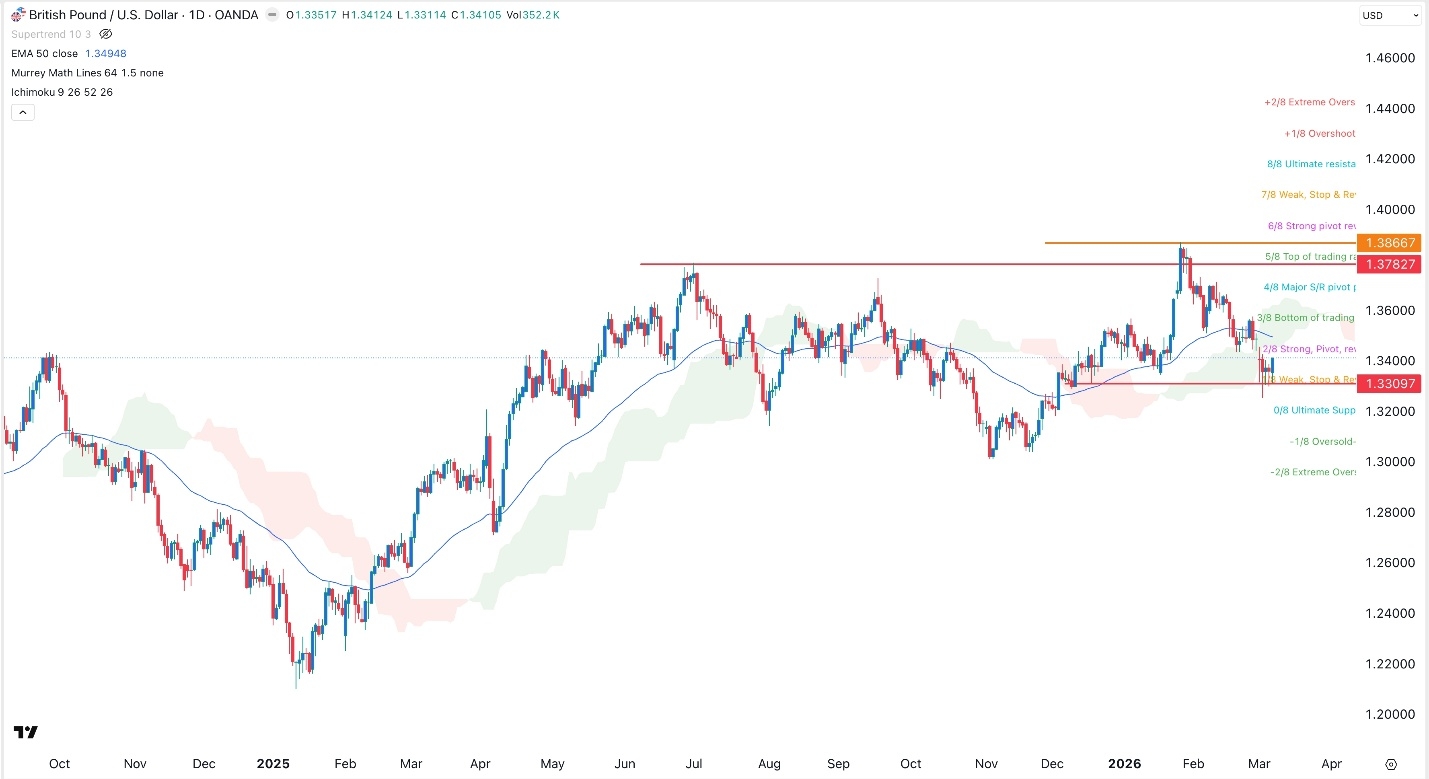
The daily timeframe chart shows that the GBP/USD pair has rebounded from a low of 1.3258 on March 3 to the current 1.3410. It has moved above the important resistance level at 1.3300, its lowest level on December 17.
The pair has remained below the 50-day Exponential Moving Average (EMA) and the Strong, Pivot, Reverse level of the Murrey Math Lines tool. It has also dropped below the Ichimoku cloud indicator.
The pair will likely resume the downward trend this week as sellers target the Ultimate Support level at 1.3183. This view will be confirmed if it moves below the key support level at 1.3300.