
American Express (NYSE:AXP) stock signal, a fundamental snapshot, and a technical view on where its share price is heading. What to know before the market opens on April 8th, 2026, after AXP closed at $307.03, up 0.43% during the previous session, before advancing 2.65% in after-market hours.
Long Trade Idea
Enter your long position between $312.46 (the intra-day high of a previous breakout) and $315.18 (its after-market hours close).
Market Index Analysis
- American Express (NYSE:AXP) is a member of the Dow Jones Industrial Average Index, the S&P 100 Index, and the S&P 500 Index.
- All three indices continue to trade inside bearish price channels with depressed bullish trading volumes.
- The Bull Bear Power Indicator for the S&P 500 Index turned bearish with a negative divergence.
Market Sentiment Analysis
Equity futures are surging this morning after the US and Iran agreed to a two-week ceasefire, and the safe passage through the Strait of Hormuz via coordination with Iran’s military. Oil prices plunged but remain close to $100 per barrel. Gold spiked despite the ceasefire, and Gulf states reported numerous attacks after the ceasefire was announced. On the corporate front, Delta Airlines will report earnings today.
American Express Fundamental Analysis
American Express is the world’s fourth-largest card network based on purchase volume. It generally caters to more affluent consumers, and it is well-known for its rewards, exclusive offers, and partnership programs.
So, why am I bullish on AXP following its breakout?
American Express benefits from a resilient premium customer base that continues to spend through macroeconomic risks. The ongoing repricing of its Platinum cardholder base, where affluent Millennials and Gen Z remain a core growth engine, creates a tailwind for fee income and profitability. I am also bullish on AXP’s increased 2026 earnings-per-share guidance and boosted dividend, while the sell-off has lowered shares to attractive valuations.
Metric | Value | Verdict |
P/E Ratio | 19.96 | Bullish |
P/B Ratio | 6.15 | Bearish |
PEG Ratio | 1.54 | Bullish |
Current Ratio | 1.40 | Bearish |
ROIC-WACC Ratio | Positive | Bullish |
American Express Fundamental Analysis Snapshot
The price-to-earnings (P/E) ratio of 19.96 makes AXP an inexpensive stock. By comparison, the P/E ratio for the S&P 500 Index is 23.64.
The average analyst price target for AXP is $359.63. It suggests excellent upside potential with manageable downside risks.
American Express Technical Analysis
Today’s AXP Signal
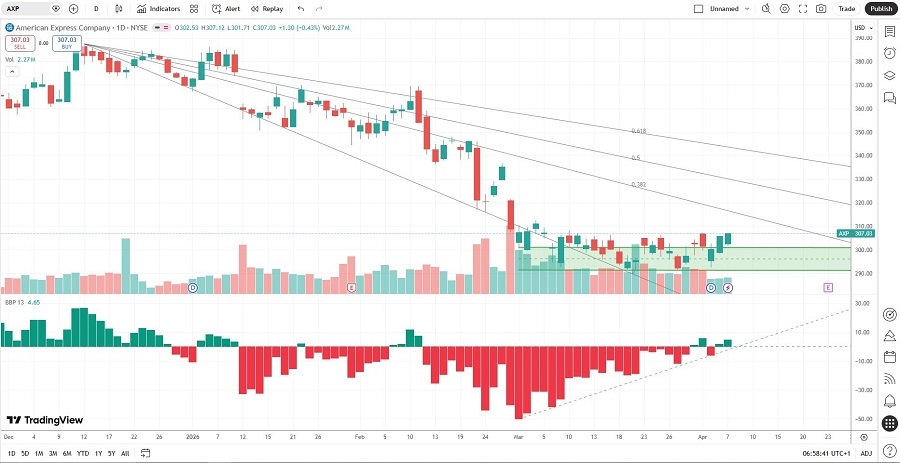
American Express Price Chart
- The AXP D1 chart shows price action breaking out above its horizontal support zone.
- It also shows price action between its descending 0.0% and 38.2% Fibonacci Retracement Fan levels.
- The Bull Bear Power Indicator turned bullish with an ascending trendline.
- The average bullish trading volumes are higher than the average bearish trading volumes.
- AXP performed better than the S&P 500 Index over the past month, a significant bullish signal.
My AXP Long Stock Trade
- AXP Entry Level: Between $312.46 and $315.18
- AXP Take Profit: Between $362.04 and $369.50
- AXP Stop Loss: Between $288.34 and $294.73
- Risk/Reward Ratio: 2.06
Ready to trade our analysis of American Express? Here is our list of the best stock brokers worth checking out.