
Bearish view
- Sell the BTC/USD pair and set a take-profit at 60,000.
- Add a stop-loss at 73,000.
- Timeline: 1-2 days.
Bullish view
- Buy the BTC/USD pair and set a take-profit at 73,000.
- Add a stop-loss at 60,000.
Bitcoin price was largely flat on Thursday as the two-month consolidation continued. The BTC/USD pair was trading at 68,000, a few points above last week’s low of 65,182.
Bitcoin Price Consolidation Continues
The BTC/USD pair has remained in a narrow range despite the ongoing accumulation of its exchange-traded funds (ETF) in the United States.
Data shows that spot Bitcoin ETFs added $1.3 billion in assets in March, a big reversal after losing assets in the past four consecutive months.
BlackRock, the biggest asset manager in the world, is working on a new premium income Bitcoin ETF, which will launch later this month. Morgan Stanley will launch its spot Bitcoin ETF next week.
The funds continued adding assets on Wednesday as investors embraced a risk-on sentiment in the market as hopes that the US-Iran war was about to end. The top US indices like the S&P 500 and Dow Jones have soared in the past few days.
Still, there are signs that the consolidation will continue in the foreseeable future. For example, the Crypto Fear and Greed Index remains in the fear zone of 32. Also, the futures open interest has continued falling in the past few months.
The BTC/USD pair will react to the upcoming US jobs data, which will help to determine the next action by the Federal Reserve. Economists expect the data to show that the economy created 50k jobs in March, with the unemployment rate rising to 4.5%.
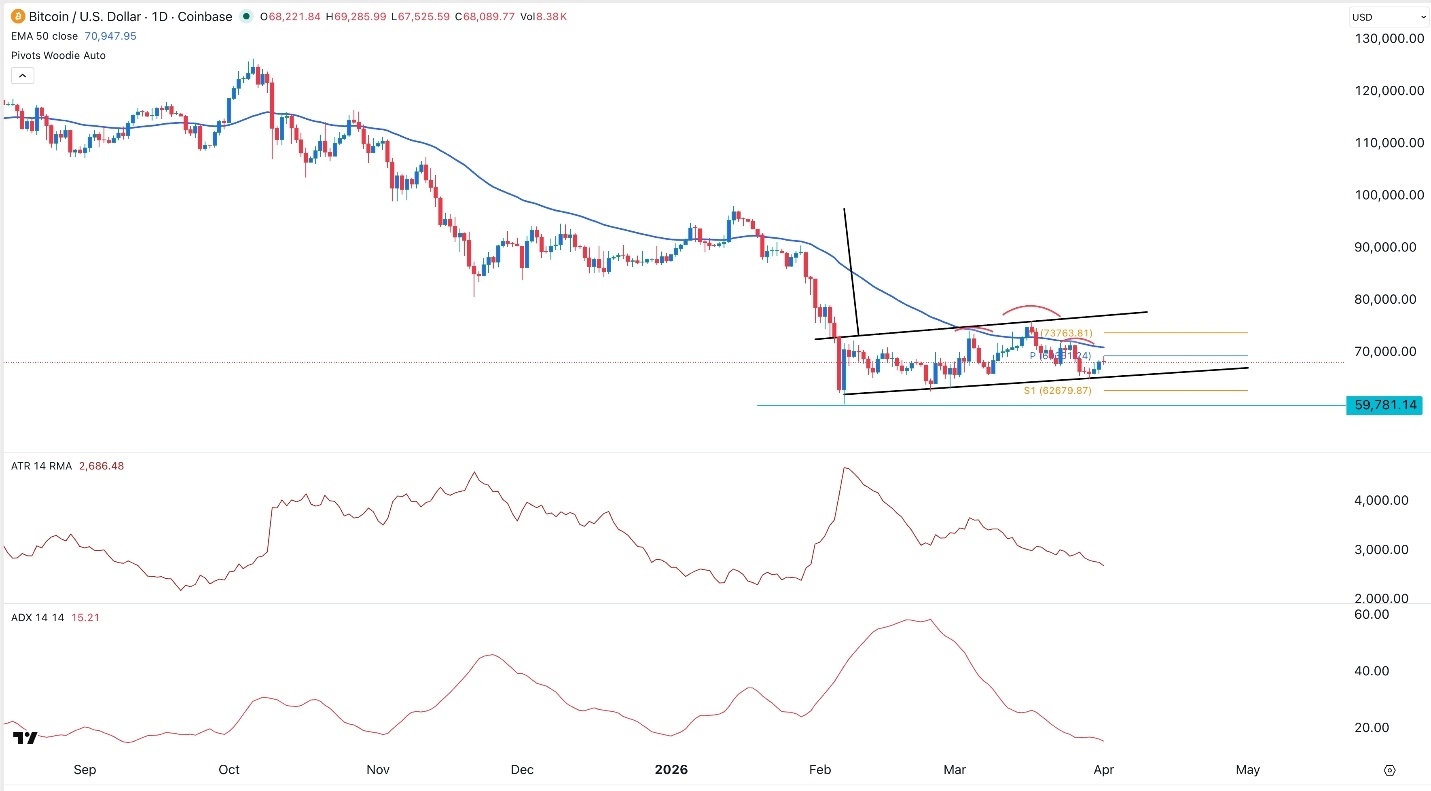
BTC/USD Technical Analysis
The daily timeframe chart shows that the BTC/USD pair has remained in a narrow range since the first week of February this year. As a result, the Average True Range (ATR) and the Average Directional Index (ADX) have continued falling this month.
The pair has dropped below the 50-day moving average. It has formed a small head-and-shoulders pattern, which often leads to more downside. It has also formed a bearish flag pattern and is close to the lower side.
Therefore, the BTC/USD pair will likely have a strong bearish breakout, potentially to the year-to-date low of 60,000. The bearish outlook will become invalid if it moves above the first resistance of the Woodie pivot point at 74,000.