
Bullish view
Buy the BTC/USD pair and set a take-profit at 80,000.
Add a stop-loss at 70,000.
Timeline: 1-2 days.
Bearish view
Sell the BTC/USD pair and set a take-profit at 70,000.
Add a stop-loss at 80,000.
Bitcoin price was largely unchanged at a crucial resistance level as traders reflected on the recent market events, including the rising ETF inflows and market manipulation in the industry. The BTC/USD pair was trading at 75,720 on Tuesday, up by 26% from its lowest level this year.
Bitcoin ETF Inflows are Rising
The BTC/USD pair moved sideways at an important resistance level as traders waited for the upcoming ceasefire deadline between the United States and Iran.
In a statement on Monday, President Donald Trump pushed the Iranians to reach an agreement and hinted that he will not extend the deadline.
The crypto market would welcome the end to the ongoing war between Iran and the US as it would bring energy prices downwards, which will lower inflation and push the Federal Reserve to cut interest rates later this year. It would also reduce the underlying volatility in the market.
Bitcoin price is also reacting to the recent market manipulation events in the crypto industry. A good example of this is RaveDAO, a token that surged from below $1 to $28 within days and then crashed below $1. Online investigators blamed the price action on market manipulation among insiders.
In another major news, KelpDAO, a relatively small player in the decentralized finance (DeFi) industry. Hackers drained millions of dollars from the platform, leading to billions of dollars in outflows from DeFi giants like Lido and Aave.
Spot Bitcoin ETFs have continued adding assets to their funds. Data shows that these funds have added over $1.6 billion in inflows this month, higher than the $1.3 billion they added last month. Before that, spot Bitcoin ETFs shed assets for four consecutive months.
The next key catalyst for the BTC/USD pair will be the upcoming Kevin Warsh hearings, which will shed more color on his plans for cryptocurrencies and interest rates.
BTC/USD Technical Analysis
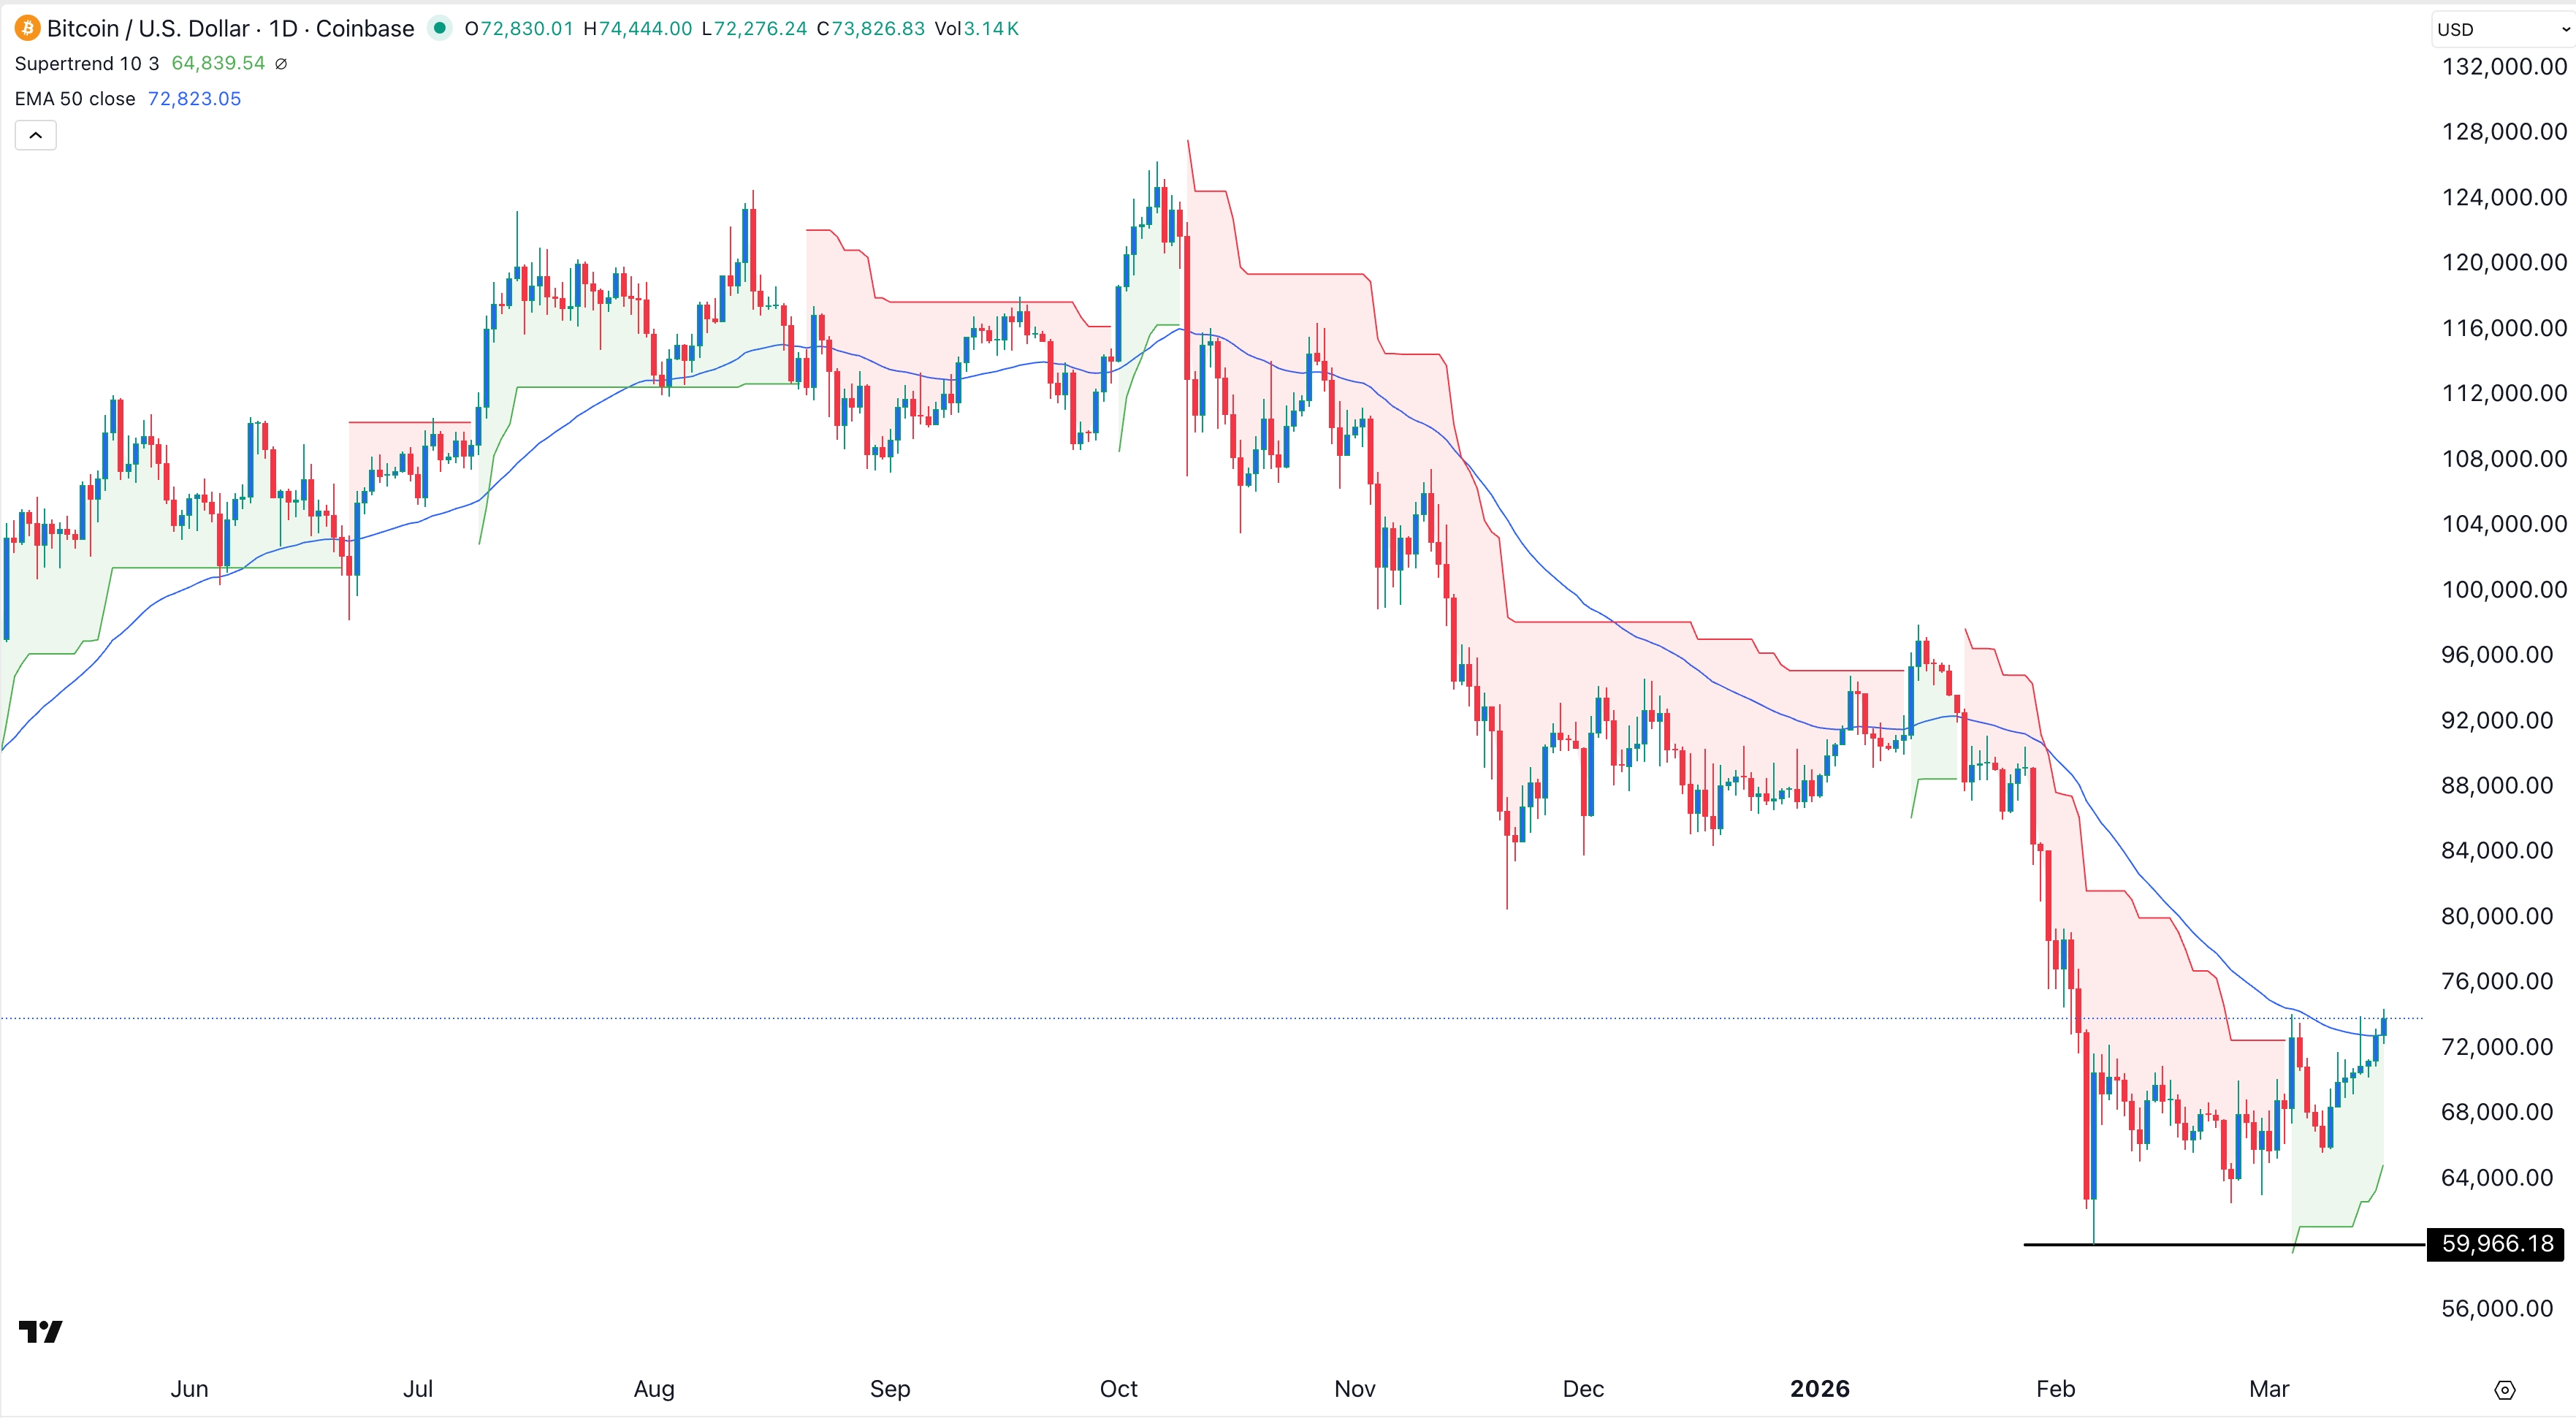
The daily chart shows that the BTC/USD pair has held steady in the past few weeks. It has moved to the key resistance level at 76,200, which coincides with the highest level on March 17. It was the upper side of the ascending triangle pattern, which is a common bullish continuation pattern.
The pair has also moved above the 50-day Exponential Moving Average (EMA) and flipped the Supertrend indicator from red to green. Also, the Relative Strength Index (RSI) and the Percentage Price Oscillator have continued rising.
Therefore, the pair will likely continue rising as bulls target the next key resistance level at 80,000. A drop below the 50-day moving average at 71,800 will invalidate the bullish outlook.