
Cognizant (NASDAQ:CTSH) stock signal, a fundamental snapshot, and a technical view on where its share price is heading. What to know before the market opens on April 8th, 2026, after CTSH closed at $61.49, down 1.38% during the previous session, before advancing 1.50% in after-market hours.
Long Trade Idea
Enter your long position between $61.01 (yesterday’s intra-day low) and $62.95 (the upper band of its horizontal support zone).
Market Index Analysis
- Cognizant (NASDAQ:CTSH) is a member of the NASDAQ 100 Index and the S&P 500 Index.
- Both indices continue to trade inside bearish price channels with depressed bullish trading volumes.
- The Bull Bear Power Indicator for the NASDAQ 100 Index turned bearish with a negative divergence.
Market Sentiment Analysis
Equity futures are surging this morning after the US and Iran agreed to a two-week ceasefire, and the safe passage through the Strait of Hormuz via coordination with Iran’s military. Oil prices plunged but remain close to $100 per barrel. Gold spiked despite the ceasefire, and Gulf states reported numerous attacks after the ceasefire was announced. On the corporate front, Delta Airlines will report earnings today.
Cognizant Fundamental Analysis
Cognizant is an IT consulting and outsourcing company. Its vertical business units focus on banking and financial services, insurance, healthcare, manufacturing, and retail. Its horizontal business units specialize in analytics, mobile computing, BPO, and testing.
So, why am I bullish on CTSH despite its 32%+ correction?
Cognizant became a strategic industry partner to the UK government's TechFirst program to address the AI talent gap, as outlined in the UK Digital & Technology Sector Plan. I am also bullish on the launch of its AI Factory platform, which lowers costs and accelerates AI processing for clients. Its 2026 revenue guidance is $22.14 to $22.66 billion, above the analyst consensus of $22.06 billion, and its adjusted EPS guidance is $5.56 to $5.70, which confirms traction in its AI strategy.
Metric | Value | Verdict |
P/E Ratio | 13.48 | Bullish |
P/B Ratio | 1.99 | Bullish |
PEG Ratio | 1.02 | Bullish |
Current Ratio | 2.14 | Bullish |
ROIC-WACC Ratio | Positive | Bullish |
Cognizant Fundamental Analysis Snapshot
The price-to-earnings (P/E) ratio of 13.48 makes CTSH an inexpensive stock. By comparison, the P/E ratio for the NASDAQ 100 Index is 34.14.
The average analyst price target for CTSH is $86.14. It suggests excellent upside potential with fading downside risks.
Cognizant Technical Analysis
Today’s CTSH Signal
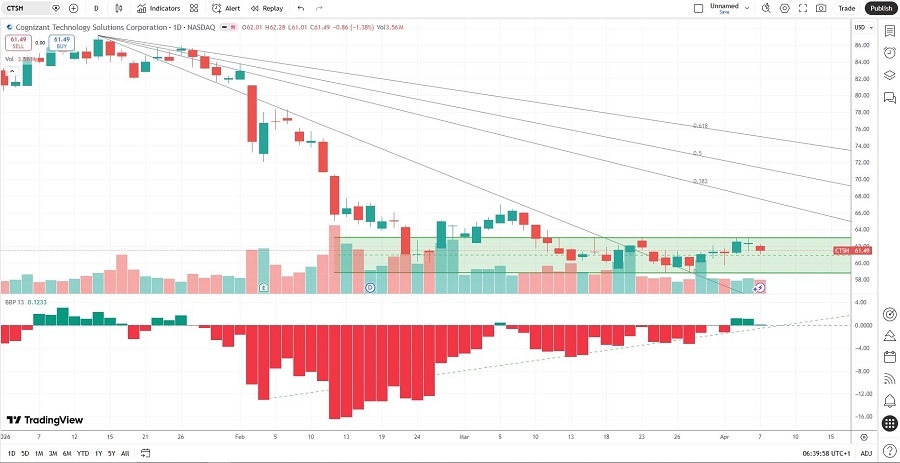
Cognizant Price Chart
- The CTSH D1 chart shows price action inside a horizontal support zone.
- It also shows price action between its descending 0.0% and 38.2% Fibonacci Retracement Fan levels.
- The Bull Bear Power Indicator is bullish with an ascending trendline.
- The average bullish trading volumes are higher than the average bearish trading volumes.
- CTSH has outperformed the NASDAQ 100 Index over the past month, a significant bullish signal.
My CTSH Long Stock Trade
- CTSH Entry Level: Between $61.01 and $62.28
- CTSH Take Profit: Between $86.14 and $87.03
- CTSH Stop Loss: Between $51.33 and $52.73
- Risk/Reward Ratio: 2.60
Ready to trade our analysis of Cognizant? Here is our list of the best stock brokers worth checking out.