
The 10-year yield continues to be a major driver of where the gold market is going.
GOLD
The gold market has of course been very noisy as of late and on Friday we basically were closed. There were some CFDs being traded in early futures trading as well, but really at this point in time it is worth noting that the volume was almost non-existent as it was Good Friday, so I am not even worried about the Friday session. What I am worried about is the 10-year yield.
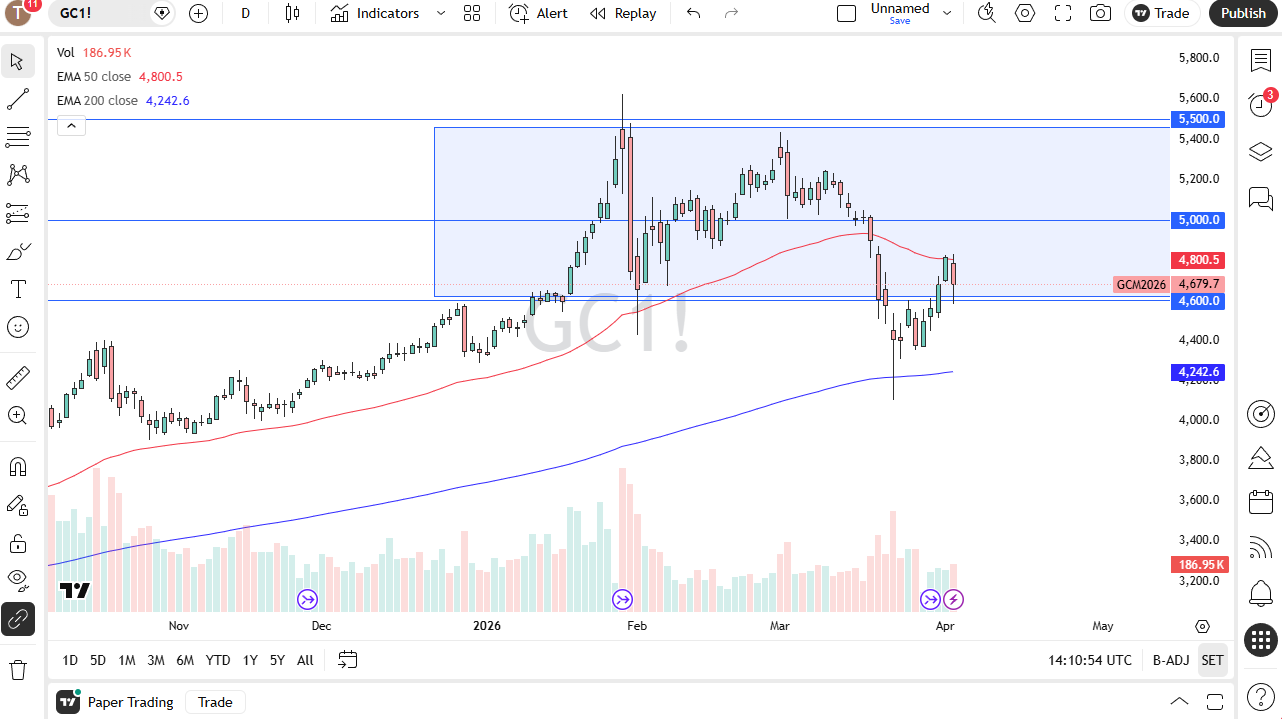
The 10-year yield has been dictating where this and other markets have been going for a while as higher rates above the 4.3% have really weighed upon precious metals like gold and silver. The gold market is currently finding the $4,600 level as significant support, so I think it matters.
Technical Resistance and Support Levels
But even if we break down below there, the $4,400 level has also shown its resilience as well. I will be watching the 10-year yield simultaneously because it is a little bit difficult to gauge what a headline might do to the gold market instead of what we can use raw data from the U.S. 10-year note and the yield to give us an idea. It is a relation that I have been watching pretty closely as of late, and it has actually made trading gold quite a bit easier.
This will change over time. It does not mean that it is always what you watch, but right now that seems to be the line in the sand and the signal. To the upside, we could go to $5,000 if we can clear $4,800 first. My email box is full of people wondering why gold has been falling for the most part during a war and the answer of course is those interest rates. So, you have to pull up a 10-year yield chart and monitor that to go with any technical setups. I am bullish longer term, but I recognize in the short term we may chop a bit with $4,600 being a bit of a magnet for price.