
Southwest Airlines (NYSE:LUV) stock signal, a fundamental snapshot, and a technical view on where its share price is heading. What to know before the market opens on April 8th, 2026, after LUV closed at $37.87, down 0.81% during the previous session, before surging 8.00% in after-market hours.
Short Trade Idea
Enter your short position between $38.88 (April’s intra-day high) and $40.90 (its after-market hours close).
Market Index Analysis
- Southwest Airlines (NYSE:LUV) is a member of the S&P 500 Index.
- This index continues to trade inside a bearish price channel with depressed bullish trading volumes.
- The Bull Bear Power Indicator for the S&P 500 Index turned bullish with a negative divergence.
Market Sentiment Analysis
Equity futures are surging this morning after the US and Iran agreed to a two-week ceasefire, and the safe passage through the Strait of Hormuz via coordination with Iran’s military. Oil prices plunged but remain close to $100 per barrel. Gold spiked despite the ceasefire, and Gulf states reported numerous attacks after the ceasefire was announced. On the corporate front, Delta Airlines will report earnings today.
Southwest Airlines Fundamental Analysis
Southwest Airlines is the fourth-largest US-based airline, serving over 100 destinations across 42 states and ten countries in the Gulf of Mexico and the Caribbean. It operates an all Boeing-737 fleet of over 810 aircraft. It also has over 500 Boeing-737 MAX on order.
So, why am I bearish on LUV despite a potential breakout?
Like all airlines, Southwest Airlines faces surging oil prices, with jet fuel costs soaring by over 105%, which threatens the 2026 full-year earnings per share target of $4.00, given average fuel cost assumptions of $2.405 per gallon. Adding to LUV’s risks is the end of its fuel hedging program in 2025, which will fully expose the airline to surging fuel costs. I am equally bearish on weak consumer sentiment and pushback against higher fees.
Metric | Value | Verdict |
P/E Ratio | 47.94 | Bearish |
P/B Ratio | 2.35 | Bearish |
PEG Ratio | 0.20 | Bullish |
Current Ratio | 0.52 | Bearish |
ROIC-WACC Ratio | Negative | Bearish |
Southwest Airlines Fundamental Analysis Snapshot
The price-to-earnings (P/E) ratio of 47.94 makes LUV an expensive stock. By comparison, the P/E ratio for the S&P 500 Index is 23.64.
The average analyst price target for LUV is $44.82. It suggests moderate upside potential with rising downside risks.
Southwest Airlines Technical Analysis
Today’s LUV Signal
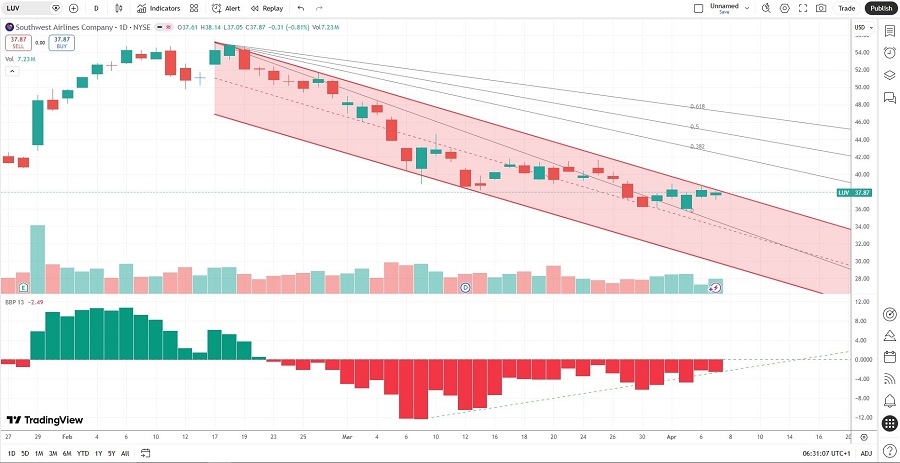
Southwest Airlines Price Chart
- The LUV D1 chart shows price action inside a bearish price channel.
- It also shows price action between its descending 0.0% and 38.2% Fibonacci Retracement Fan levels.
- The Bull Bear Power Indicator is bullish with a positive divergence, hinting at more short-term volatility.
- The average bearish trading volumes are higher than the average bullish trading volumes.
- LUV corrected more than the S&P 500 Index, a bearish confirmation.
My LUV Short Stock Trade
- LUV Entry Level: Between $38.88 and $40.90
- LUV Take Profit: Between $23.82 and $25.26
- LUV Stop Loss: Between $46.02 and $48.39
- Risk/Reward Ratio: 2.11
Ready to trade our analysis of Southwest Airlines? Here is our list of the best stock brokers worth checking out.