


Bearish View
Sell the BTC/USD pair and set a target at 58,000.
Add a stop-loss at 66,000.
Timeline: 1-2 days.
Bullish View
Buy the BTC/USD pair and set a take-profit at 66,000.
Add a stop-loss at 58,000.
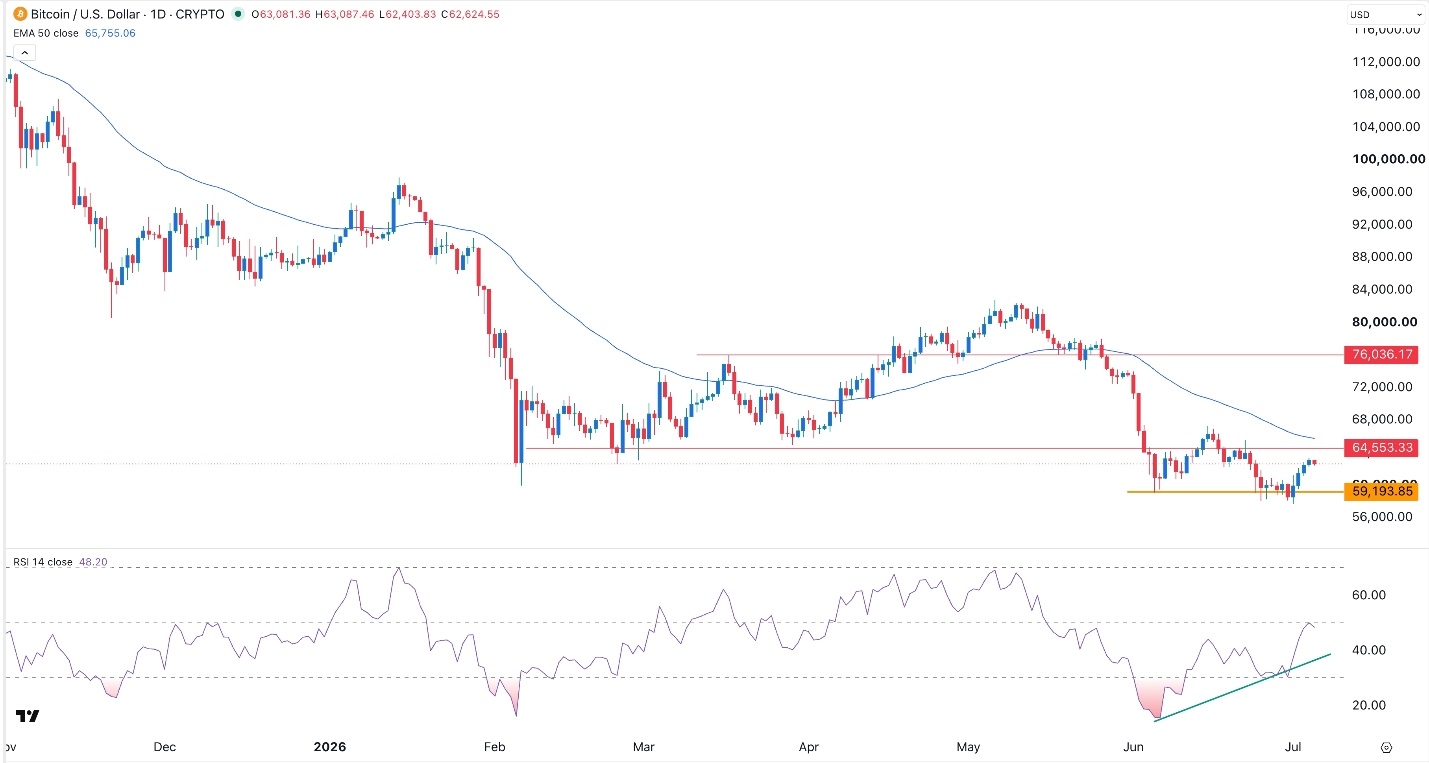
Bitcoin price wavered on Monday as the recent sell-off stalled and as investors started repurchasing spot Bitcoin ETFs. It also rose as traders predicted that the Federal Reserve would not hike interest rates in the near term. The BTC/USD pair was trading at 62,670, a few points above the year-to-date low of 57,828.
Bitcoin ETF Inflows and Long-Term Holders Buying
The BTC/USD pair has risen in the past few days as investors reacted to the strong ETF inflows on Thursday. These funds added over $220 million in assets on Thursday this week. It was the first time that these funds added assets in over 10 years.
The inflows happened as the stock market experienced substantial volatility, with top shares like Micron and SanDisk rising and falling sharply. For example, the viral DRAM ETF has retreated by over 20% from its highest point this year.
Bitcoin also rose after the weak non-farm payrolls data on Thursday, which lowered the odds of rate hikes later this year. The report showed that the economy added just 57k jobs, the worst performance in months. It also revised the May jobs report downward.
Still, the ongoing recovery faces some major challenges ahead. One of the risks is that Strategy is expected to sell some of its coins to raise enough to fund its dividends to preferred shares like STRC and STRK. This happened after the company paid debt worth over $1.5 billion in May, leading to a substantial retreat in its cash reserves.
Strategy has become one of the top Bitcoin buyers in the past few years and now holds over 847,300 coins, currently valued at over $53.1 billion. As such, if it starts selling, there is a likelihood that other treasury companies will start selling as well, putting more pressure on the coin.
Top Regulated Brokers
BTC/USD Technical Analysis
The daily chart shows that the BTC/USD pair has risen gradually in the past few days. It rose from the year-to-date low of 58,000 to the current 62,745. Still, despite the retreat, the coin remains below the 50-day moving average and the middle line of the Bollinger Bands.
The Average Directional Index (ADX) has pulled back from a high of 46.46 on June 11 to the current 31. That is a sign that the recovery is losing momentum. Therefore, the BTC/USD pair will likely resume the downside and point to more downside towards 58,000.
Ready to trade our free Forex signals? Here are the best MT4 crypto brokers to choose from.