


Fundamental Backdrop and Market Sentiment
I wrote on 26th July that the best trades for the week would be:
Long of the USD/JPY currency pair. This produced a gain of 0.90% over the week.
Short of the EUR/USD currency pair. This produced a loss of 3.88% over the week.
The total loss of 4.78% averages to 2.39% per asset.
Top Regulated Brokers
A summary of last week’s most important data in the market:
US FOMC Meeting Minutes – a minor hawkish tilt due to the three-member hawkish dissenting block vote and the general concern in the language over inflation, but this didn’t stop the Dollar weakening.
UK CPI (inflation) – this rose as expected to 2.9%, with the lack of a dovish surprise helping the Pound to strengthen.
Canadian CPI (inflation) – this was just a tick higher than expected month over month, which may have given the Loonie a very small tailwind.
Australian Unemployment Rate – this rose unexpectedly from 4.4% to 4.5%, giving the Aussie a hawkish tilt as it is seen to reduce the chance of a rate cut by the Reserve Bank of Australia over the near term.
UK Claimant Count Change – the data were a little better than expected, but it was nothing worth getting excited about.
The currencies which were affected by these items last week were the US Dollar, the British Pound, and the Australian Dollar. The two latter currencies gained in line with the news, but the US Dollar fell quite sharply despite the hawkish FOMC, due to the market’s main story of the past week: the Treasury Department said it would at least double liquidity-support buybacks of 10- to 30-year securities. That initially sparked a sharp rally, sending yields and the US Dollar plummeting, but by the end of the week markets were shrugging it off as little more than a liquidity measure. The US clearly has a problem with rising long-term rates but so far the Treasury has not been able to stop it. Interestingly, although it seemed to firm at the end of last week, the US Dollar has continued to trade lower, continuing an increasingly long-term bearish trend.
Another item of note is the collapse late Friday in trade negotiations between the USA and Canada, which will mean the imposition of tariffs of 50% on $20 billion worth of Canadian imports, with Canada set to impose retaliatory tariffs on 8th September. This could be negative for the Canadian Dollar, putting a bullish USD/CAD scenario in focus.
The Week Ahead: Key Data and Events to Watch
Next week will see highly important data items. The coming week’s most important data points, in order of likely importance, are:
US Core PCE Price Index
US Preliminary Benchmark Payrolls Revision
US Preliminary GDP
Australian CPI (inflation)
Canadian GDP
Additionally, the Jackson Hole Symposium of central bankers will commence towards the end of the week and could bring some public remarks which will be of interest to the market.
Monthly Forex Forecast: August 2026 Overview
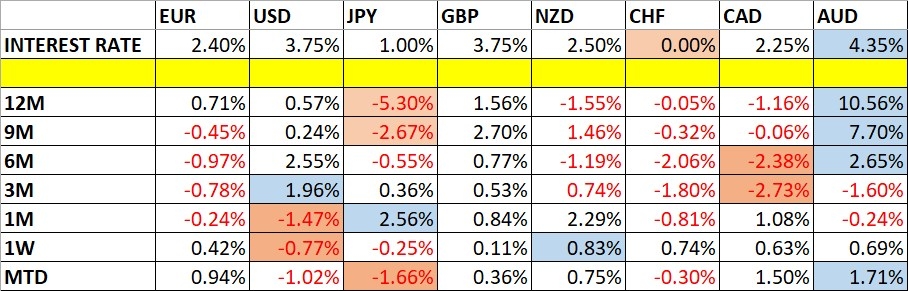
Currency Price Changes and Interest Rates
For the month of August, I made no forecast.
Weekly Forecast 23rd August 2026
This week, I make no forecast, as there were no exceptional price movements last week.
Volatility was average to low last week, with 22% of the notable currency pairs and crosses moving by more than 1% in value. Next week’s volatility is likely to be similar.
You can trade these forecasts in a real or demo Forex brokerage account.
Technical Overview and Key Levels
Key Support and Resistance on Major FX Pairs
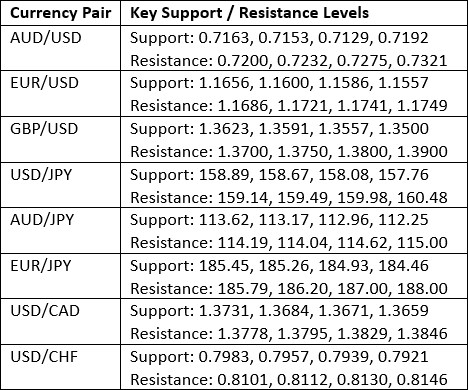
Key Support and Resistance Levels
US Dollar Index
The US Dollar printed a bearish candlestick last week, closing not very far from its range low, but leaving some amount of lower wick. The weekly closing price was below its level of 3 months ago but not 6 months ago, indicating an indecisive long-term trend. The price action is bearish over the short-term, showing momentum there, but the chart is suggestive of continuing consolidation when you zoom out.
I think the greenback with either do little over the coming week or possibly fall a bit further. In any case, it does not look like much to worry about, with the market’s focus over the coming week possibly being on other assets. However, there will be some high-impact US economic data coming, so we might see a more meaningful move.
I am very comfortable being either long or short of the US Dollar right now. I slightly prefer being short.
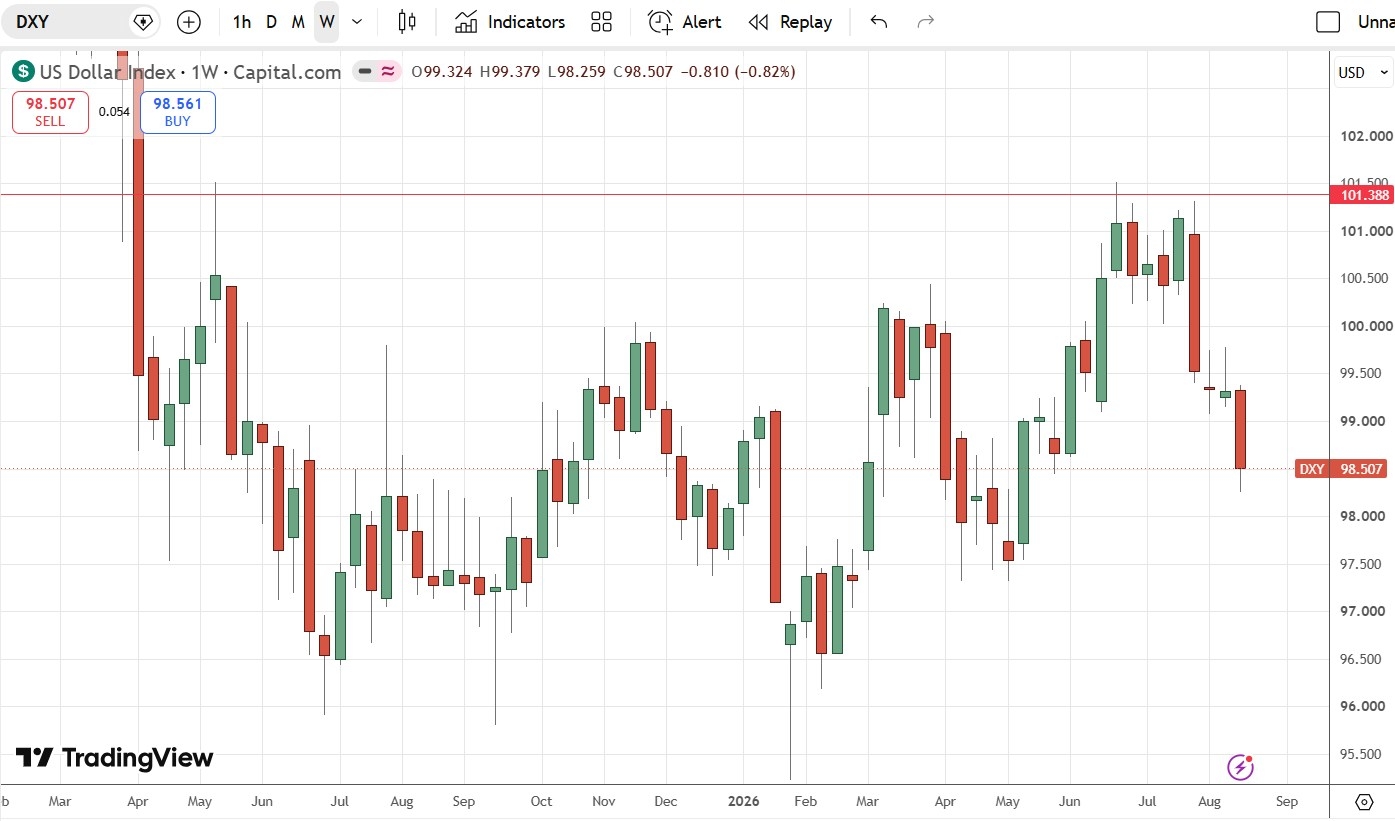
US Dollar Index Weekly Price Chart
GBP/USD
The GBP/USD currency pair made several bullish breakouts last week, reaching a fresh 3-month high and getting established above the long-term resistance level at $1.3553. The Pound has been the most consistently strong major currency over the past year and is supported by its relatively high interest rate and inflation rate, leading to a hawkish central bank that has little product of cutting rates. The US Dollar has continued to lose value over the past week, and this was boosted by the Treasury’s intervention in the long-dated bond market.
The weekly candlestick was relatively large, bullish, and closed near the high of its range. It made its highest weekly closing price since February.
As this currency pair tends to be one of short-term momentum, and the momentum here is clearly bullish and breaking out, I think a long trade is worthy here.
The clouds on the horizon for bulls are the 6-month high holding above $1.3658 and the more hawkish tilt shown in the FOMC meeting minutes last week. Also, the weekly price chart below does look “boxy”, the long-term action is consolidative, and the breakout is not particularly strong at the recent top.
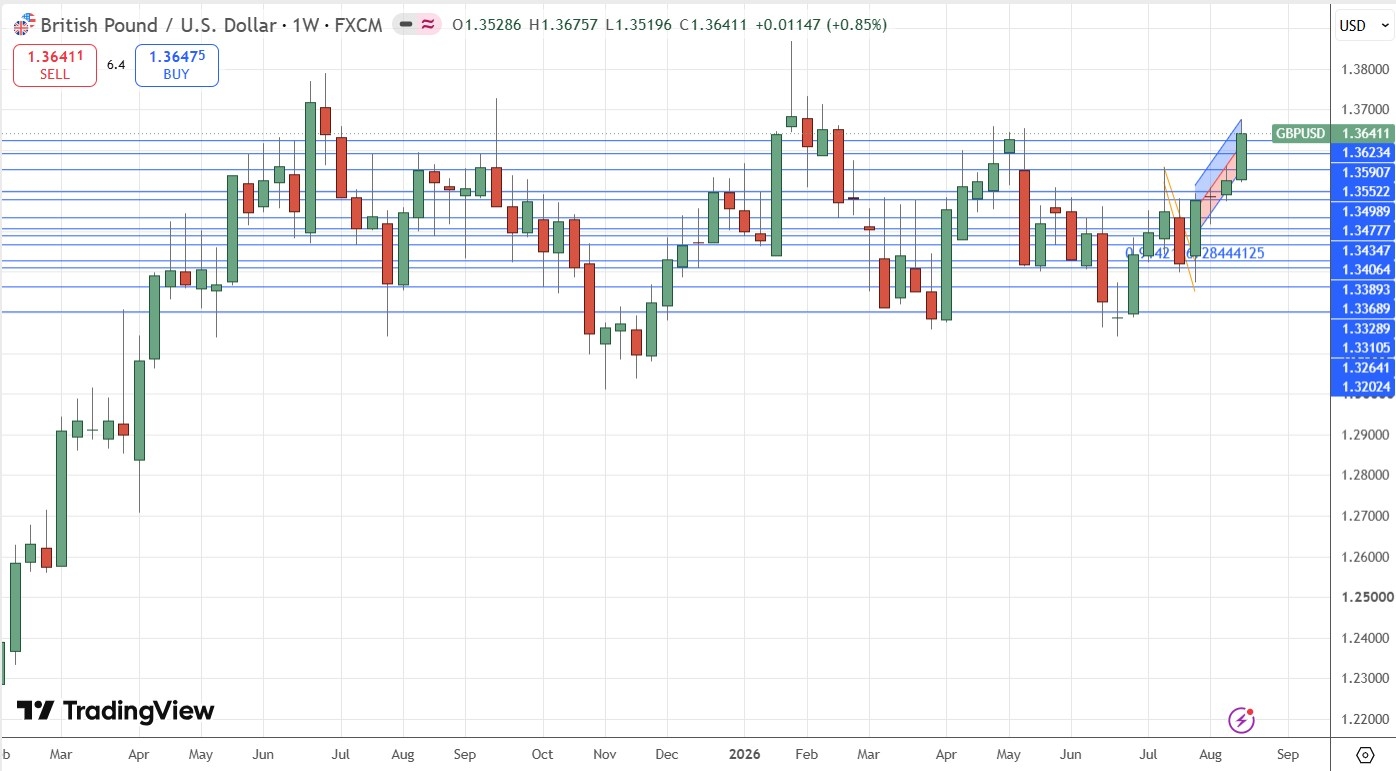
GBP/USD Weekly Price Chart
USD/CAD
Before discussing the weekly price chart shown below, it is worth noting that we got important news over the weekend which will affect the economies of Canada and to a lesser extent the USA – the new tariffs the USA will be placing at 50% on $20 billion worth of Canadian imports this year, with Canadian retaliation to follow. Most analysts see this as likely to be a bit negative for the Loonie, so it should give some boost to bulls on the USD/CAD currency pair.
Turning to technical factors, we see a fourth fat bearish candlestick this week, showcasing the persistent bearish momentum we have seen for almost an entire month. This is driven partly by weakness in the US Dollar, and partly by the rebound in the price of Crude Oil, which the Canadian Dollar tends to be strongly positively correlated with.
Despite the bearish price action, we see the nearest support level hold strong and the $1.3750 area just below it looks likely to be strong based upon past price action in that area. So, there are both technical and fundamental reasons why this pair might be due a bounce, which could be violent as it might trigger stop levels just above key resistance levels shown in my support and resistance table earlier.
A speculative long for swing traders might be an interesting trade here.
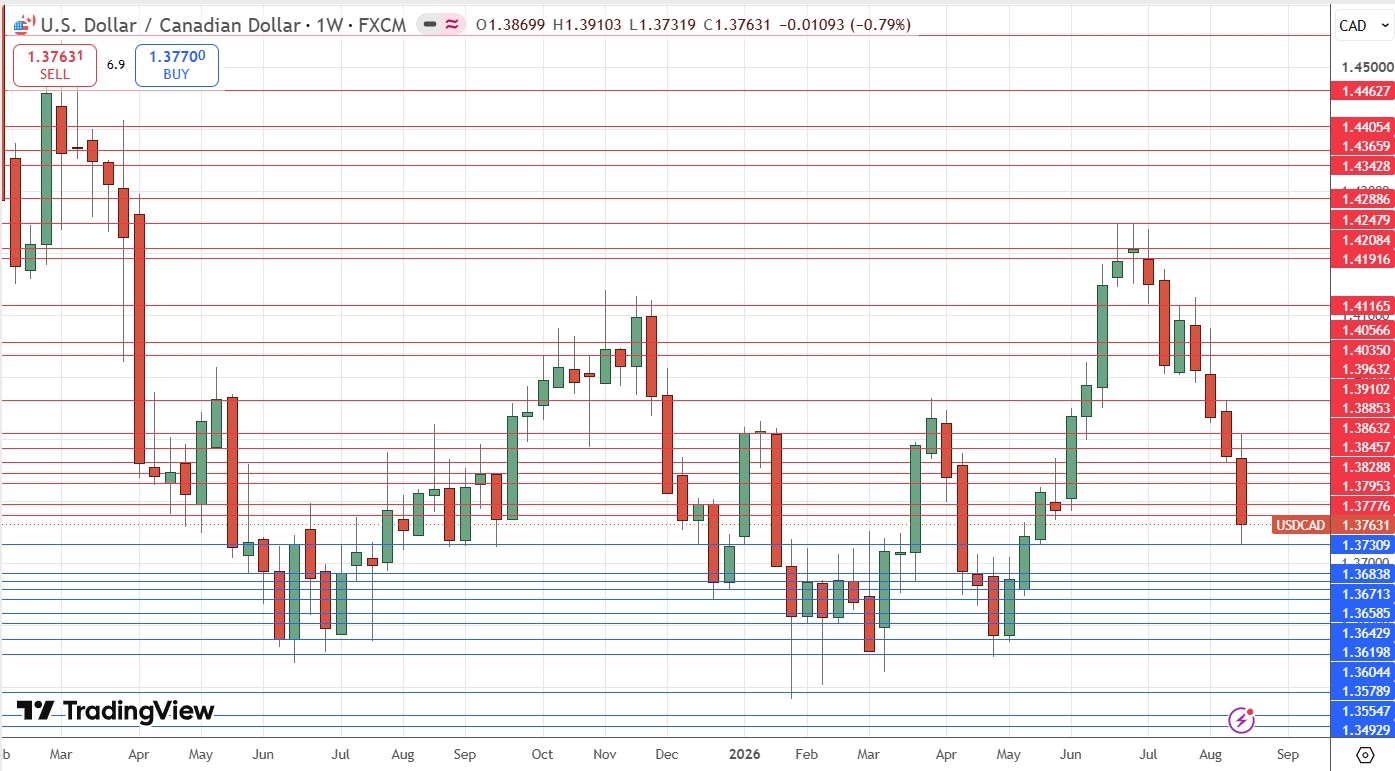
USD/CAD Weekly Price Chart
USD/MXN
The USD/MXN made its fifth consecutive lower week, reaching a new 2-year low price on this steady bearish momentum. A further bearish sign is that the week’s close was very close to the low. With a relatively weak US Dollar and a strong Mexican Peso, there are good reasons to be interested in being short of this currency pair.
There is another incentive to be long of the Mexican Peso – it has a relatively high interest rate, which means many brokers will pay positive swap if you hold it overnight past the New York rollover. This will be even more pronounced against a particularly low-rate currency such as the Swiss Franc.
A short trade here is attractive to both trend traders and carry traders but beware as exotic currencies such as the Peso can suddenly and dramatically reverse.
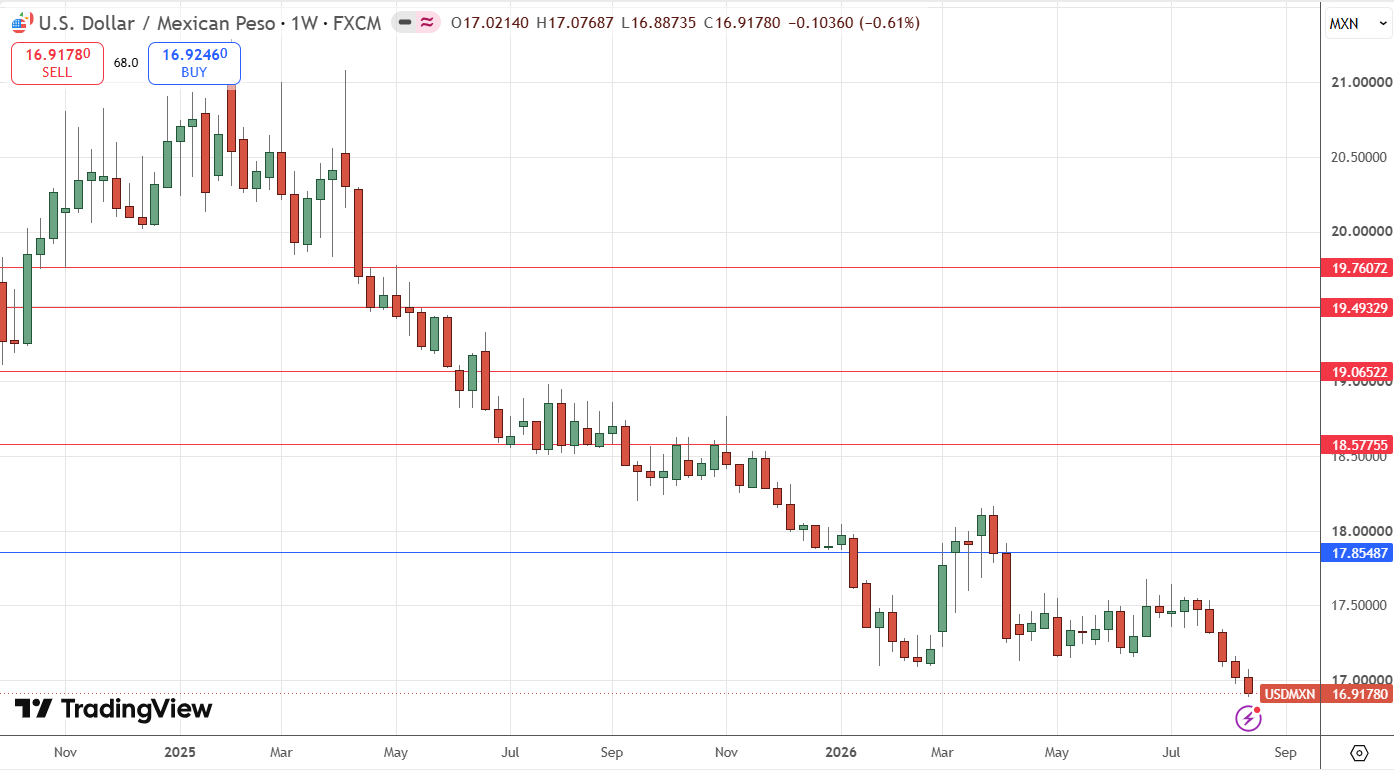
USD/MXN Weekly Price Chart
Sugar Futures
Sugar futures have exploded higher this month, rising by approximately 20% to make a strong bullish breakout to a new 15-month high price. The daily price chart below shows the strength of this move higher is such that even the moving average ribbon has turned bullish, making this an acceptable long trade now to trend trading institutions.
The recent price action is not strongly bullish but still does not rule out a move higher, it arguably even suggests it. So although there might be volatile retracements or even a complete flop, as being long of agricultural commodities (“softs”) on bullish breakouts has been such a strongly-performing strategy historically, I took the trade long here a few days ago.
Fundamental drivers include problematic weather in Brazil, and a greater allocation of India’s sugar crop towards energy generation and away from use as food.
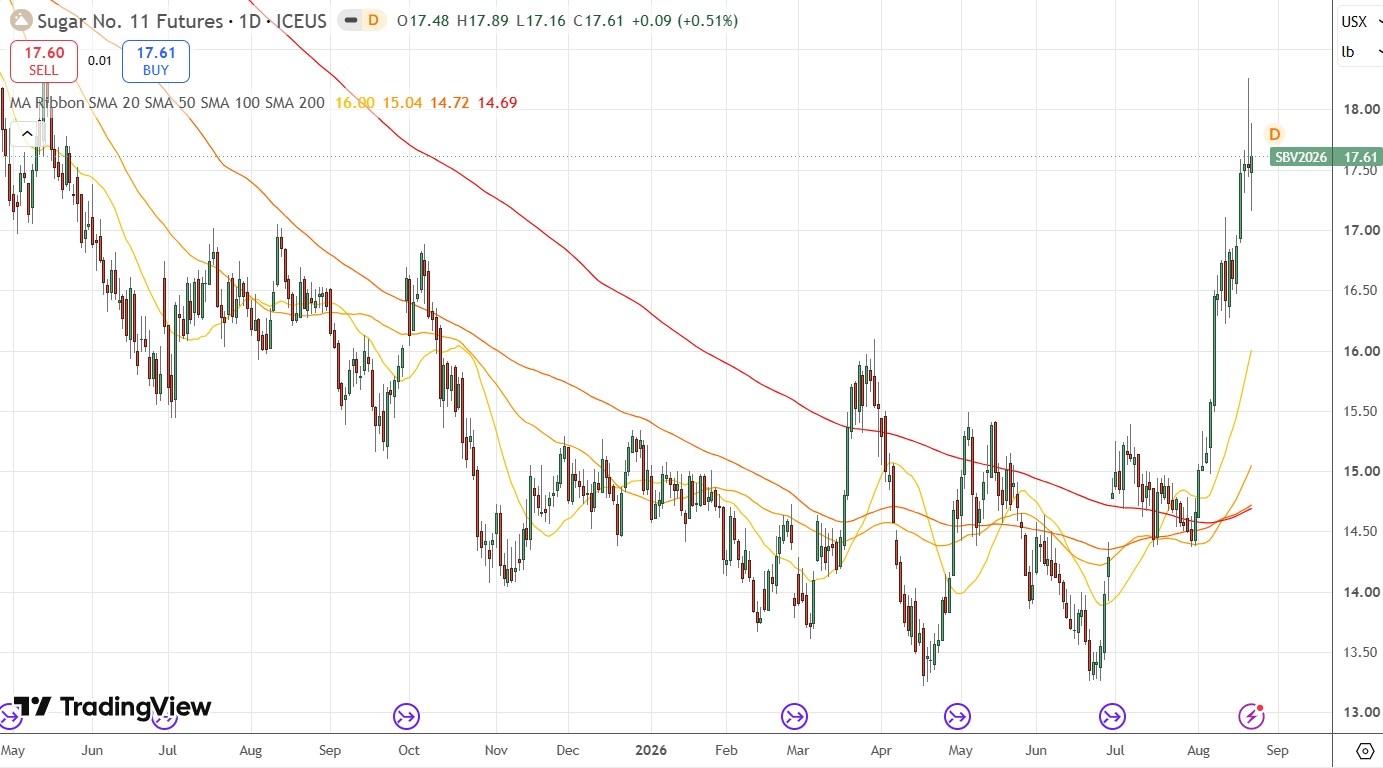
Sugar Futures Daily Price Chart
Gold
Gold has proven me a right – during July I was saying about Gold, “if you are thinking of buying, it will likely be wiser once the trend line and more importantly resistance level which I mentioned is decisively broken.” This was a great call as the trend line break right at the end of July was a good signal to enter long, with Gold rising by almost 10% from there in only four weeks.
Despite the strongly bullish move, I prefer to wait for longer-term breakouts before going long of commodities – I like to see new 6-month high prices, which can help keep me out of premature trade entries.
It is also worth noting that the price just touched and rejected an obvious overhead resistance level at $4.636 and this might continue to hold, capping the upside for a while. In any case, it is likely to be a pivotal point over the coming week, so if the price breakouts above it and starts to use it as support, that could be an excellent bullish sign signaling a move higher to $4,869.
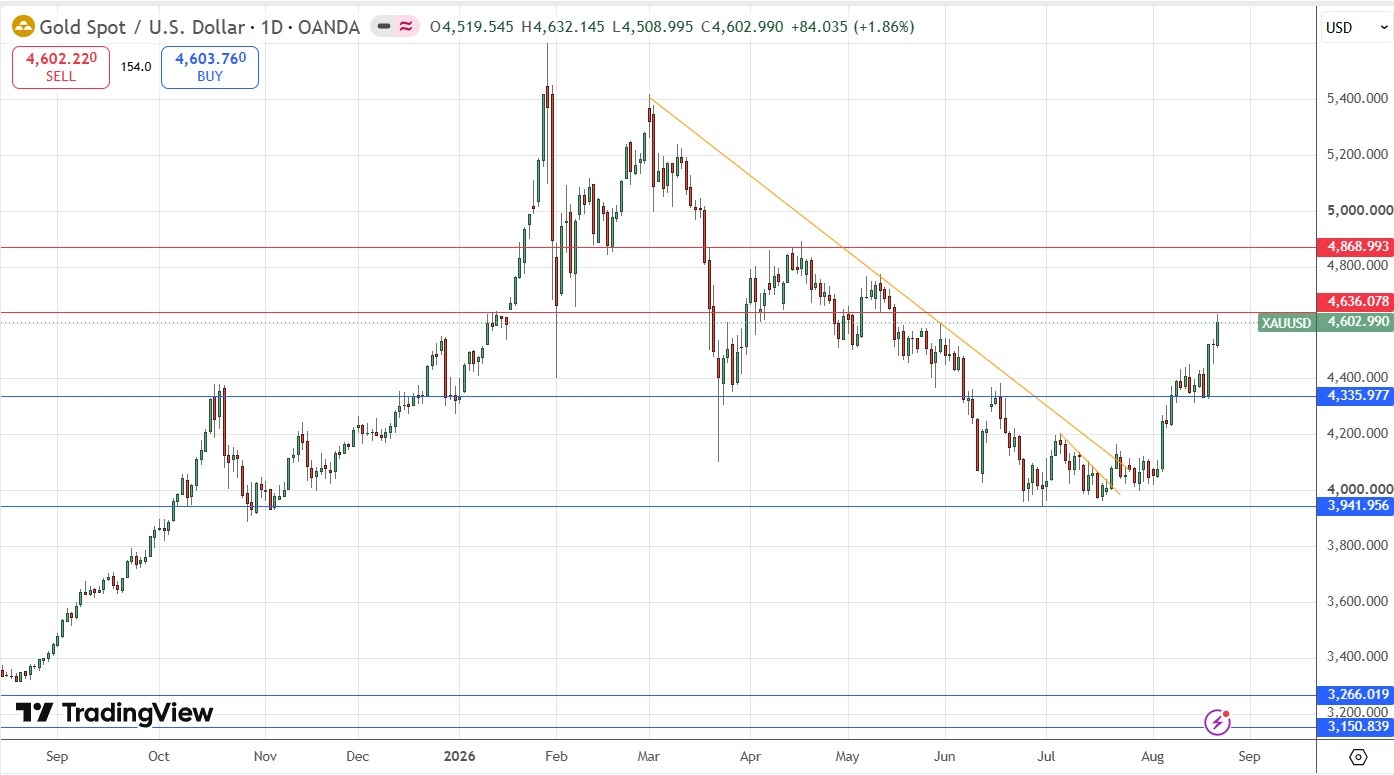
Gold Daily Price Chart
WTI Crude Oil
WTI Crude Oil is starting to show a very interesting technical feature in its daily chart below – a symmetrical descending price channel which also looks like a bullish flag! Yet I think its more of a descent than flag.
Despite the fighting words from Tehran, it is becoming clear that the USA has effectively neutralized the true bite of Iran’s Strait of Hormuz closure weapon – the USA has reached a point where sufficient oil is being successfully exported from that Gulf to prevent the price from becoming overly elevated. The descending trend lines are where we see the general downwards trend manifesting since the start of the USA – Israel – Iran war at the end of last February.
Due to the technical formation and the confluence of the upper trend line and horizontal resistance level at $86.68, this level starts to look very pivotal for the coming week, potentially signaling a short trade if it continues to hold, or a long trade if the price gets established above it. On the other hand, I would not be comfortable with a long trade unless the Iranians are able to pull some kind of major surprise at the Strait of Hormuz soon. With President Pezeshkian openly calling for a formal end to the war, that looks unlikely to happen.
WTI Crude Oil is likely to be more interesting to day traders than to anyone else.
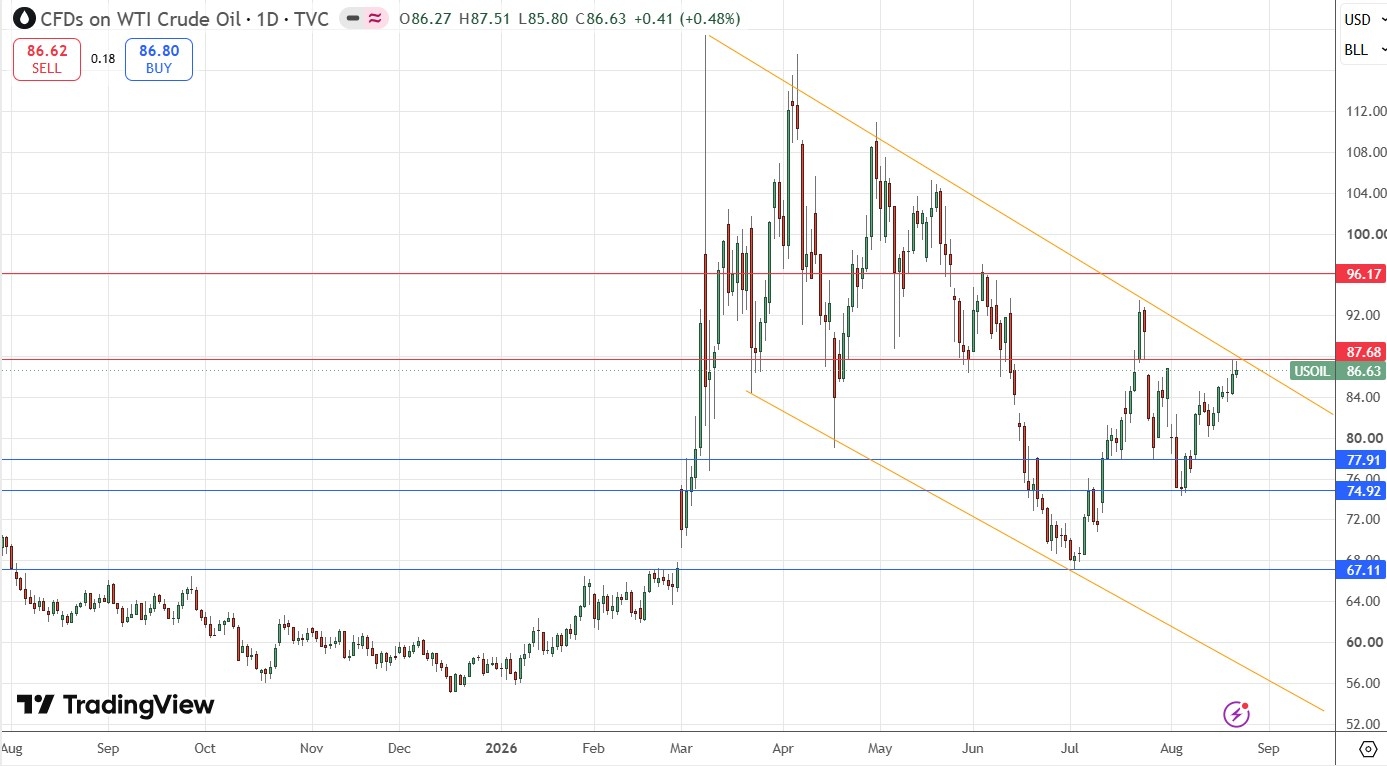
WTI Crude Oil Spot Daily Price Chart
Bottom Line
I see the best trades this week as:
Long of Sugar.
Long of the GBP/USD currency pair.
Ready to trade our Forex weekly forecast? Check out our list of the best Forex brokers.