


USD/INR exposes a structural asymmetry that punishes overleveraged retail traders: a persistent institutional uptrend undercut by sharp intraday reversals that exploit thin overnight volumes. The pair has traded near 95.76 resistance, then reversed lower in early sessions, yet the broader upward trajectory remains intact. This divergence between structural demand and tactical volatility defines the immediate trading regime.
Market Structure: The Persistent Uptrend vs. Intraday Selling Friction
USD/INR has ground higher from 95.45 to near 95.76 over three weeks, driven by institutional demand tied to Indian government fiscal spending, FDI flows, and USD yield advantage. Yet overnight sessions expose a critical vulnerability: thin volumes allow liquidations to trigger sharp reversals. Today's early selloff from 95.76 to 95.66 illustrates the tension: institutions pursue higher prices medium-term, but low liquidity creates intraday whipsaw risk on 20 to 30 pip moves that punish overleveraged positions.
Top Regulated Brokers
Why Now: Geopolitical Oil Risk, RBI Policy Expectations, and Volume Drought
Three factors amplify current friction: Iranian tensions elevate crude oil, forcing energy-importer India to spend more rupees on imports and supporting USD demand. The RBI's December policy decision (expected to hold the 6.5% repo rate) biases INR weaker if rates remain steady, extending the uptrend. Simultaneously, daily USD/INR turnover has contracted 35 to 40% from the summer baseline, creating conditions where small institutional rebalances trigger outsized intraday swings. Retail traders underestimate this combination of geopolitical USD support, policy INR weakness, and illiquidity that transforms routine order flow into sharp reversals.
Technical Structure: Resistance Cluster, Support Anchor, and the Institutional Demand Shadow
USD/INR tests a resistance cluster at 95.70 to 95.80, with the 50-day EMA anchoring support near 95.62 and the 200-day SMA providing a deeper floor at 95.35. Rallies above 95.75 occur on compressed turnover, which is a behavioral signature of institutional positioning rather than retail demand. Volume analysis shows low participation on both upside and downside moves, indicating the true institutional bid is anchored at the 50-day EMA while resistance remains contested. A daily close above 95.80 would signal renewed accumulation and target 95.95 to 96.10 within 5 to 7 sessions; a break below 95.62 would expose the 200-day SMA. This bottleneck reflects genuine uncertainty: geopolitical and policy tailwinds justify a push to 96.00, but overnight carry costs and profit-taking reversals signal an interim top remains contested.
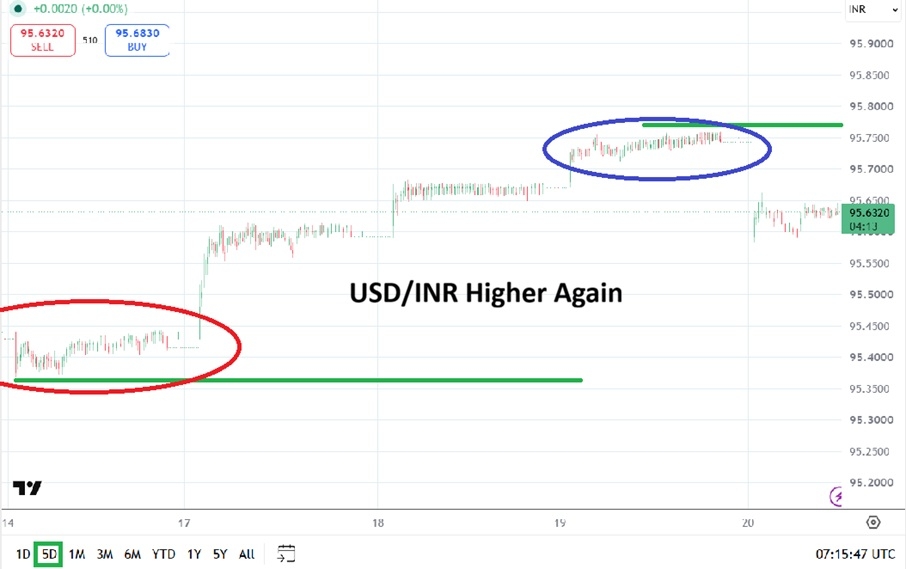
USD/INR Price Chart
The Retail Trap: Why Overleveraged Positions Fail in Low-Volume Regimes
Retail traders face acute vulnerability in USD/INR's low-volume structure. A trader entering long at 95.65, targeting 95.80, encounters an overnight 50-lot institutional rebalance ($5M notional) that drops the pair 15 pips to 95.50 in thin volume. An overleveraged position (5 micro lots on a $5K account, creating 10:1 leverage) triggers a margin call at this 15-pip drawdown and liquidates before the bounce. By the time USD/INR rallies back to 95.65 later in the session, the retail trader has been wiped out, having taken a loss on a move that ultimately proved directionally correct. The trap is structural: institutional demand is real, but low-volume intraday volatility exceeds retail leverage capacity, making participation unsafe without position sizing discipline.
Alternative Scenario: When Institutional Demand Reverses
The primary thesis assumes institutional USD demand persists (driven by geopolitical oil support and RBI policy bias). Several conditions would invalidate this view. A sharp crude oil decline or SPR release would strip USD of its tailwind, allowing INR to stabilize. An RBI rate-cut signal (low-probability) would extend the downside, but unexpected Indian services PMI weakness could trigger a policy pivot later. Within USD/INR itself, multiple failed clears above 95.80 followed by consolidation at 95.50 would signal exhausted accumulation. The critical invalidation level is a daily close below 95.50. A decisive break below this level would signal institutional demand has reversed or been satisfied, exposing the 200-day SMA at 95.35 and suggesting retail selling has begun to dominate the regime.
What to Watch: Overnight Sessions and Asian Morning Resistance
The critical monitoring window is the overnight and early Asian morning session, when London-Asia overlap (13:00 to 15:00 UTC) concentrates institutional rebalancing in thin volume. If USD/INR holds above the 50-day EMA (95.62) and rallies toward 95.75 to 95.80, institutional bid is confirmed. A break below 95.65 questions momentum. Watch for volume spikes above 50M notional, which would be a signature of participation shift, whether institutional capitulation or retail panic. Intraday patterns are predictable: overnight carry advantage (elevated INR borrowing costs make long USD/INR attractive) versus morning profit-taking at resistance creates a repeating rhythm of Asian rallies and London pullbacks. Traders who recognize this pattern can position tactically without fighting the structural uptrend.
USD/INR's uptrend persists despite repeated intraday reversals, exposing a structural asymmetry: institutional demand is real, but thin overnight volumes create whipsaw risk that punishes overleveraged retail positions. The 50-day EMA at 95.62 anchors institutional support, while the 95.75 to 95.80 resistance cluster tests whether accumulation will extend above 96.00 or consolidate lower. Watch the early Asian morning session (13:00 to 15:00 UTC) for volume patterns and EMA holds - the critical invalidation threshold is a daily close below 95.50, which would signal institutional demand has reversed.
Ready to trade our analysis of the USD/INR? Here is our list of the best Forex brokers in India worth reviewing.