


Top Regulated Brokers
The market structure is changing, but the ongoing correction introduces another technical question into the market. Institutional buyers have signaled renewed conviction after a multi-week uncertainty, and Bitcoin's price structure now hinges on whether their return represents a durable shift or merely a relief bounce masking deeper seller defense.
The market faces an asymmetry: spot Bitcoin ETF inflows have accelerated, yet technical support zones suggest downward risks remain high, creating genuine uncertainty about trend durability. This tension between institutional entry signals and structural price friction defines the near-term outlook.
ETF Inflows Signal Renewed Institutional Bitcoin Demand
Bitcoin’s latest rally has pushed the market back above a technically important support zone after a strong rebound from June lows below $60,000. The BTC/USD pair climbed to an eight-month high above $87,300 last week, before correcting toward its current level of $82,800. This retracement leaves the $80,000 level as the main test of whether the advance can develop into a more durable recovery.
Bitcoin’s bullishness was accompanied by strong institutional demand through spot Bitcoin exchange-traded funds. US-based spot Bitcoin ETFs recorded approximately $2.4 billion in net inflows during the week ended Sept. 25, their strongest weekly intake since October 2025.
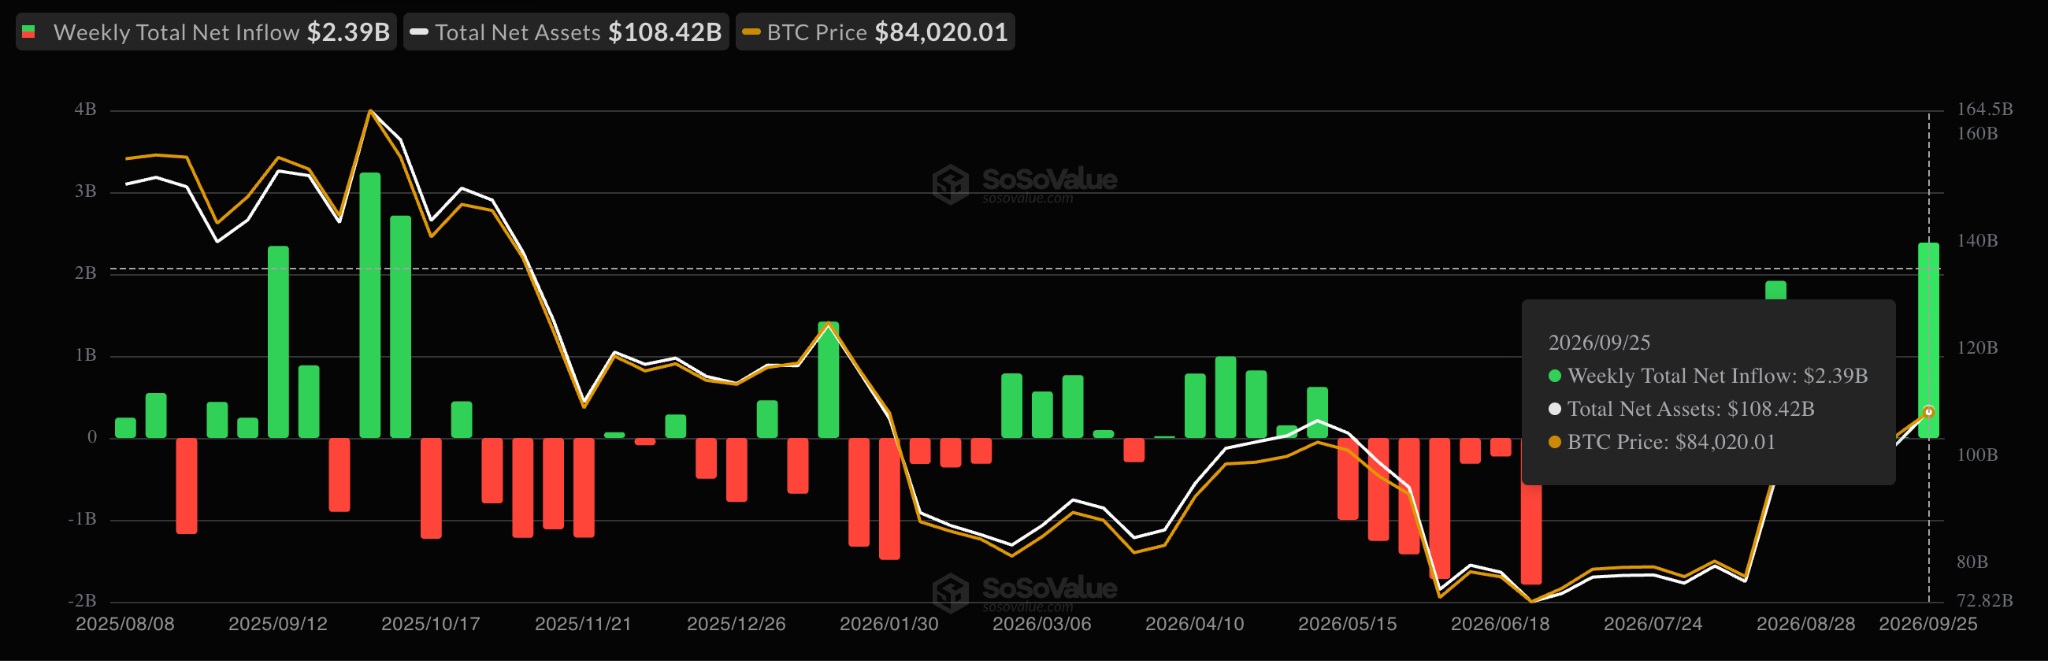
Spot Bitcoin ETF flows table. Source: SoSoValue
That is significant because Bitcoin had struggled with persistent ETF outflows during parts of the summer. The return of sustained inflows provides a source of demand capable of absorbing some of the supply coming from short-term traders taking profits after BTC's rapid rebound.
“U.S. Bitcoin ETFs just recorded their BIGGEST weekly inflow of 2026,” Coin Bureau said in a Monday Post on X.
Coin Bureau pointed out that the $2.39 billion worth of Bitcoin ETF inflows last week, ‘smashed the previous 2026 weekly record of $1.92 billion set in August,” adding:
“Institutional demand for Bitcoin just hit a fresh yearly high.”
ETF analyst Nate Geraci said last week’s inflows were large enough to push Bitcoin ETFs’ 2026 net flows back into positive territory “after being in $5.7bil hole back in July.”
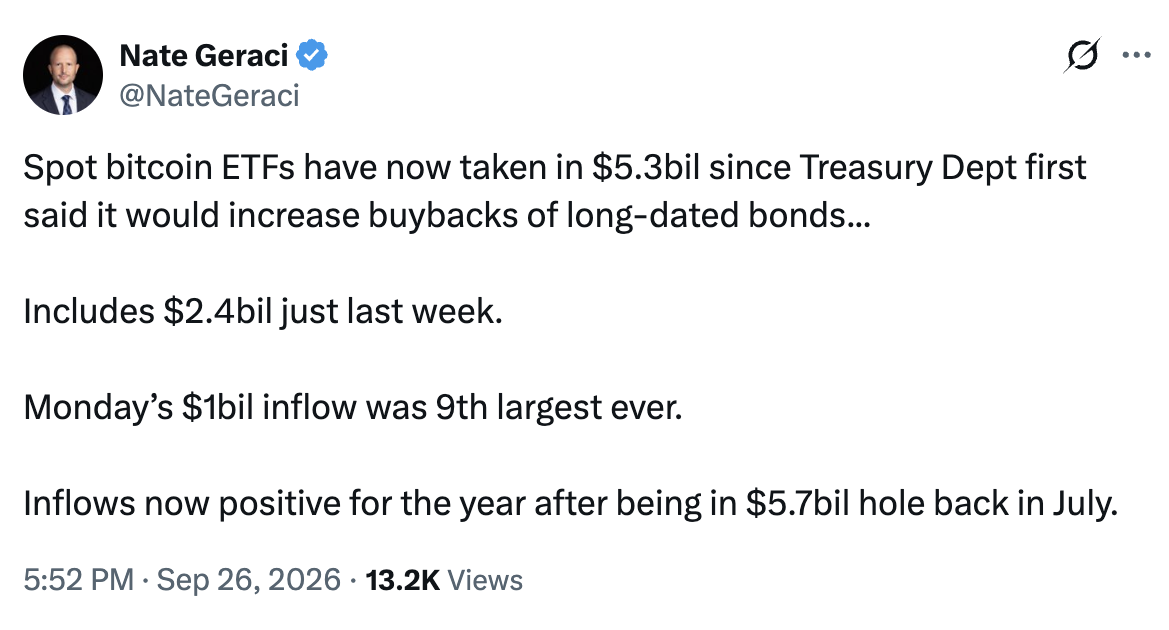
Source: Nate Geraci/X
Historically, large institutional inflows have always occurred during periods when Bitcoin is transitioning from weak price action into stronger momentum. For example, during the previous major Bitcoin advance in October 2025, spot ETF inflows reached approximately $2.7 billion at the end of September, accompanying a 20% BTC price rise to the current all-time highs above $126,000.
The key question now remains whether ETF demand remains persistent after the initial price acceleration.
Why $80,000 Remains Bitcoin’s Critical Support Level
Bitcoin’s bullishness now hinges on whether the price holds above $80,000 or not. This area acts as an immediate line of defense to Bitcoin after its latest rally fizzled just above this area.
Holding above the $80,000 psychological level would improve the immediate structure, but losing it would provide stronger evidence that the short-term trend is changing.
The chart below shows BTC/USD around $82,887, with the 50-week SMA near $77,661. Bitcoin therefore remains above both the psychological $80,000 threshold and its 50-week moving average, although the latest weekly candle shows rejection from the recent highs.
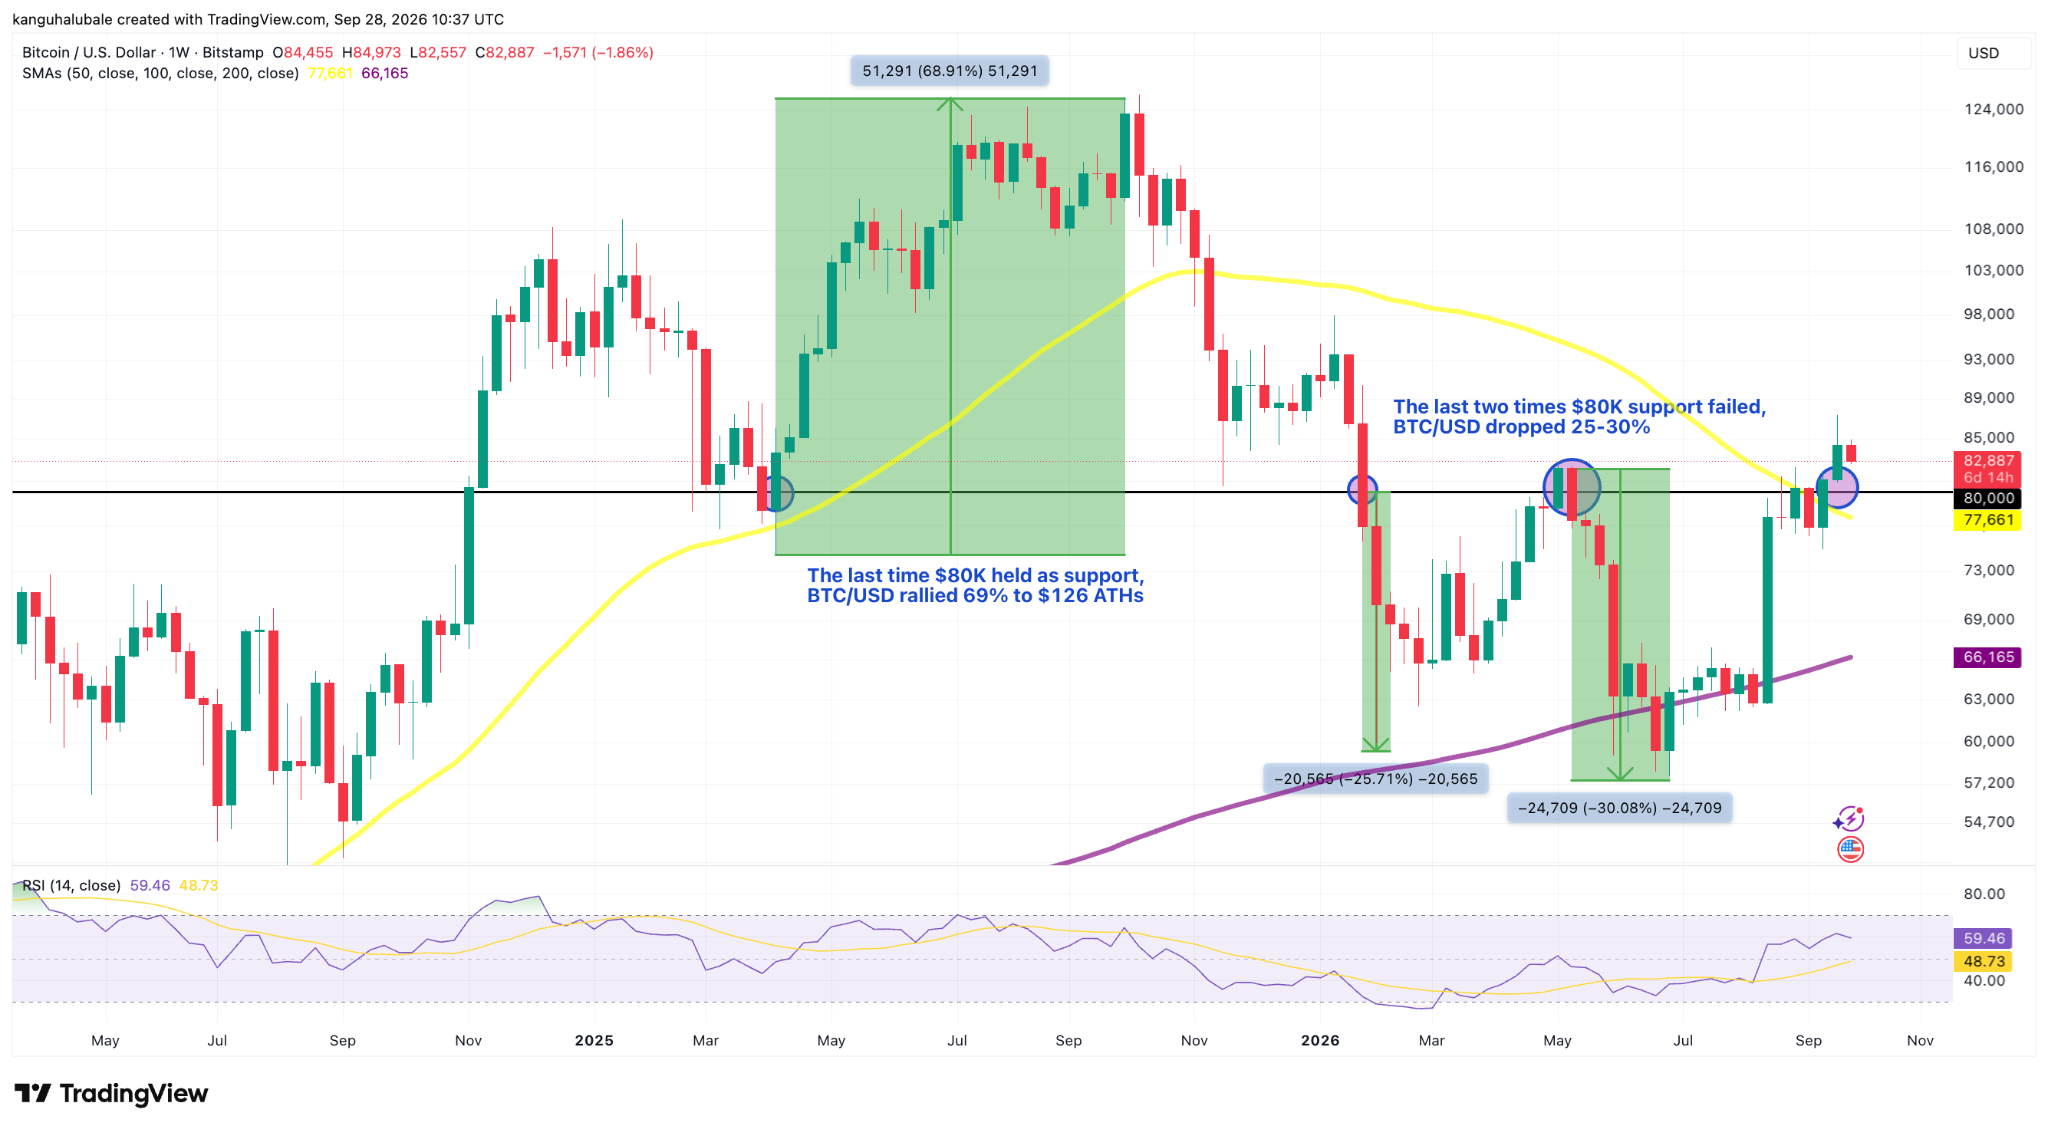
BTC/USD weekly chart. Source: TradingView
Bitcoin’s historical behavior reinforced the importance of the $80,000 support level. When the pioneer cryptocurrency established $80,000 as support in April 2025, the BTC/USD pair subsequently rallied approximately 69% to its current all-time highs of $126,000. By contrast, the last two occasions when $80,000 support failed, it was followed by losses of between 25% and 20%.
This does not mean another 69% advance or 25%-30% decline must follow the current test. Rather, the historical reactions illustrate why the level has become a useful market-structure filter.
A sustained hold above $80,000 would keep the recent breakout structure intact and leave the bulls to contend with immediate resistance around the $85,000-$87,000 zone. A decisive break below it, particularly on a weekly closing basis, would weaken the recovery and raise the probability of a deeper retracement toward lower moving-average support.
Buyer Positioning Adds Support Around $80,000
The liquidation heatmap provides another reason to watch this level. Large bid-side walls persist at support, and spot volume has not yet reached the conviction levels typical of a sustainable breakdown. This combination - strong institutional inflows meeting entrenched buyer demand - signals that any price drops may require multiple tests at $80,000 before a clean breakdown emerges.
Retail positioning often interprets inflows as trend confirmation, but order book mechanics frequently expose the friction that deflates euphoric moves into consolidation or sharp bounceback.
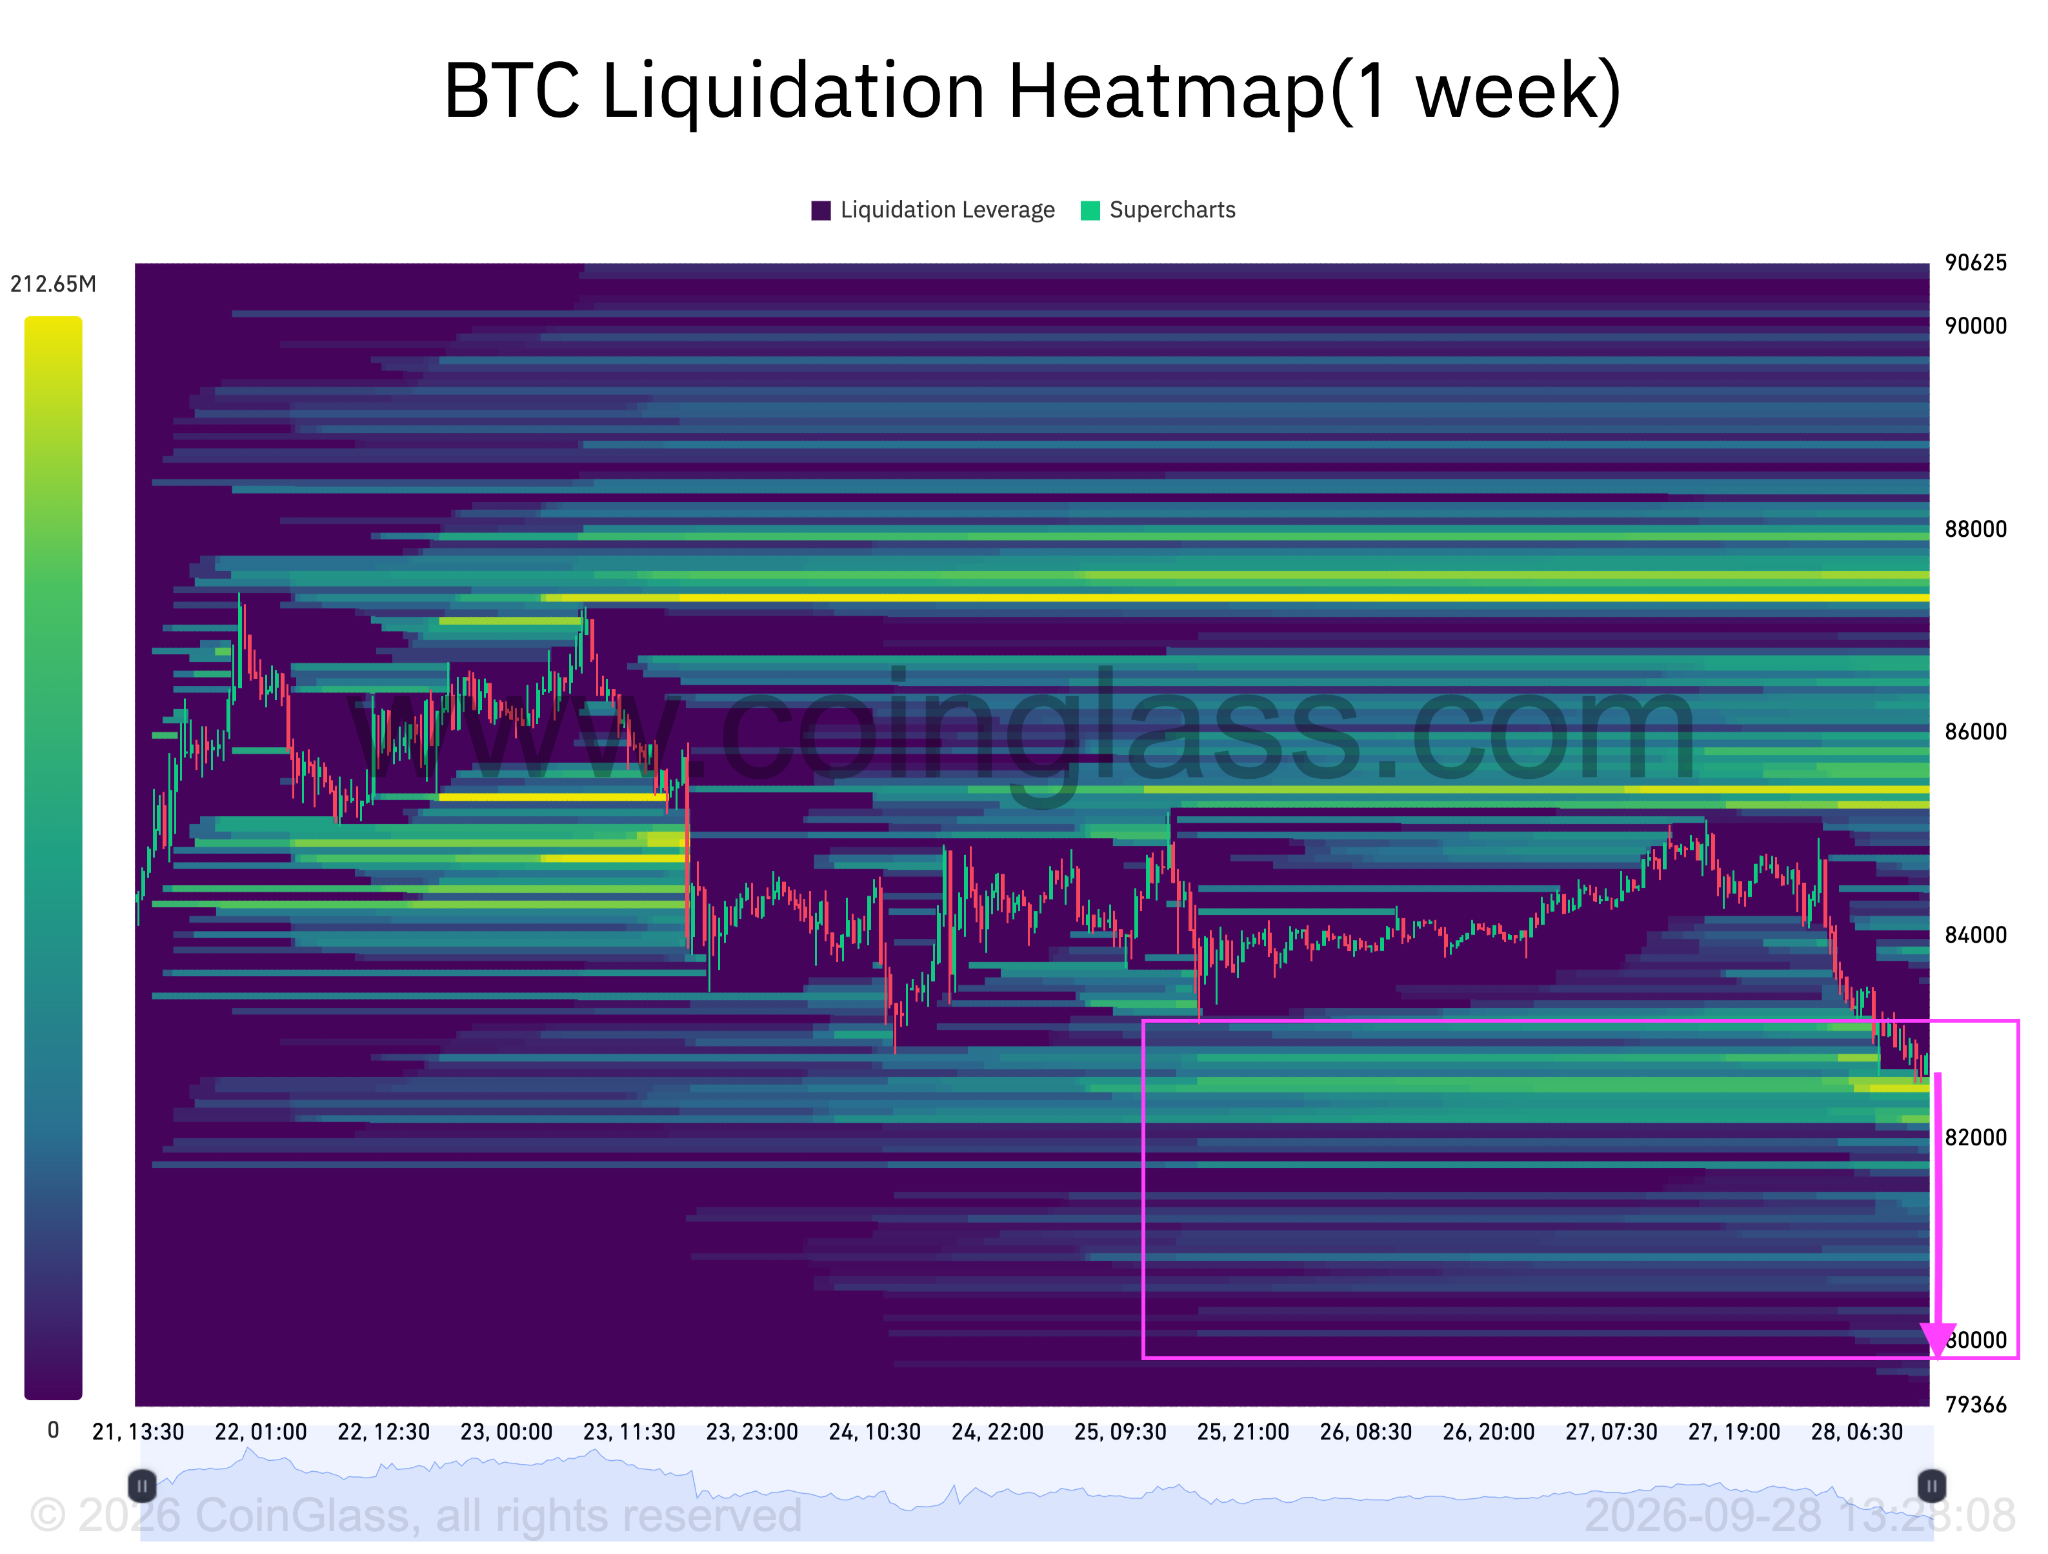
Bitcoin liquidation heatmap. Source: CoinGlass
What Bitcoin Needs to Preserve Its Bullish Structure
The bullish case would remain intact if BTC/USD can defend $80,000 on a weekly closing basis while ETF inflows remain positive. That combination would indicate that institutional demand is helping absorb profit-taking and that buyers continue to defend the breakout zone.
A sustained hold could expose the recent $85,000-$87,000 resistance zone again. A break above that range would remove an important layer of near-term supply and put the market in a position to challenge higher resistance levels: $90,000 and above. The longer-term technical structure would also remain constructive while Bitcoin trades above its 50-week SMA near $77,661.
The first invalidation parameter is, therefore, clear: a weekly close below $80,000. That would suggest the recent move above the level was not fully accepted by the market and could classify the rally as a relief recovery rather than a confirmed trend reversal. In that scenario, the 50-day SMA would become the next line of defense.
The second warning signal would be a renewed deterioration in ETF flows. The recent $2.4 billion weekly intake has provided meaningful evidence of institutional demand, but the declining daily flow sequence means that momentum needs to be sustained rather than assumed.
For now, the market remains at an inflection point. Holding $80,000 while ETF demand persists would preserve the bullish structure and keep the recent highs in focus. A weekly failure below the level, especially accompanied by negative ETF flows and heavier spot selling, would materially weaken that structure and expose Bitcoin to a deeper correction.
Ready to trade our analysis of Bitcoin? Here’s our list of the best MT4 crypto brokers worth reviewing.