


Bitcoin’s 12% rise over the last four days has changed the tone of the market after regulatory uncertainty and tighter monetary policy had kept traders cautious. The move is notable because it came after the Senate failed to advance the CLARITY Act and the Federal Reserve raised interest rates. Instead of extending the recent weakness, Bitcoin found a new catalyst in regulatory experimentation and improving technical structure.
Top Regulated Brokers
The rebound also matters because BTC has reclaimed levels that traders use to distinguish a recovery from a broader change in market regime. Leveraged shorts have been forced to close as Bitcoin moved through resistance, adding another source of demand.
Bitcoin’s Rally Reflects Regulatory Relief and Short Covering
Bitcoin rallied during the early Asian trading hours on Monday, rising to an eight-month high of $85,248. The last time the BTC/USD pair traded above $85,000 was on Jan. 29, before the pair dropped 33% to sub-$60,000 levels in early February.
The move followed the SEC’s Sept. 17 decision to grant temporary, conditional “Innovation Exemption” relief to certain tokenized securities venues. The order allows eligible venues to trade tokenized National Market System stocks on-chain through permissioned automated market makers and liquidity pools, with limited relief for qualifying liquidity providers.
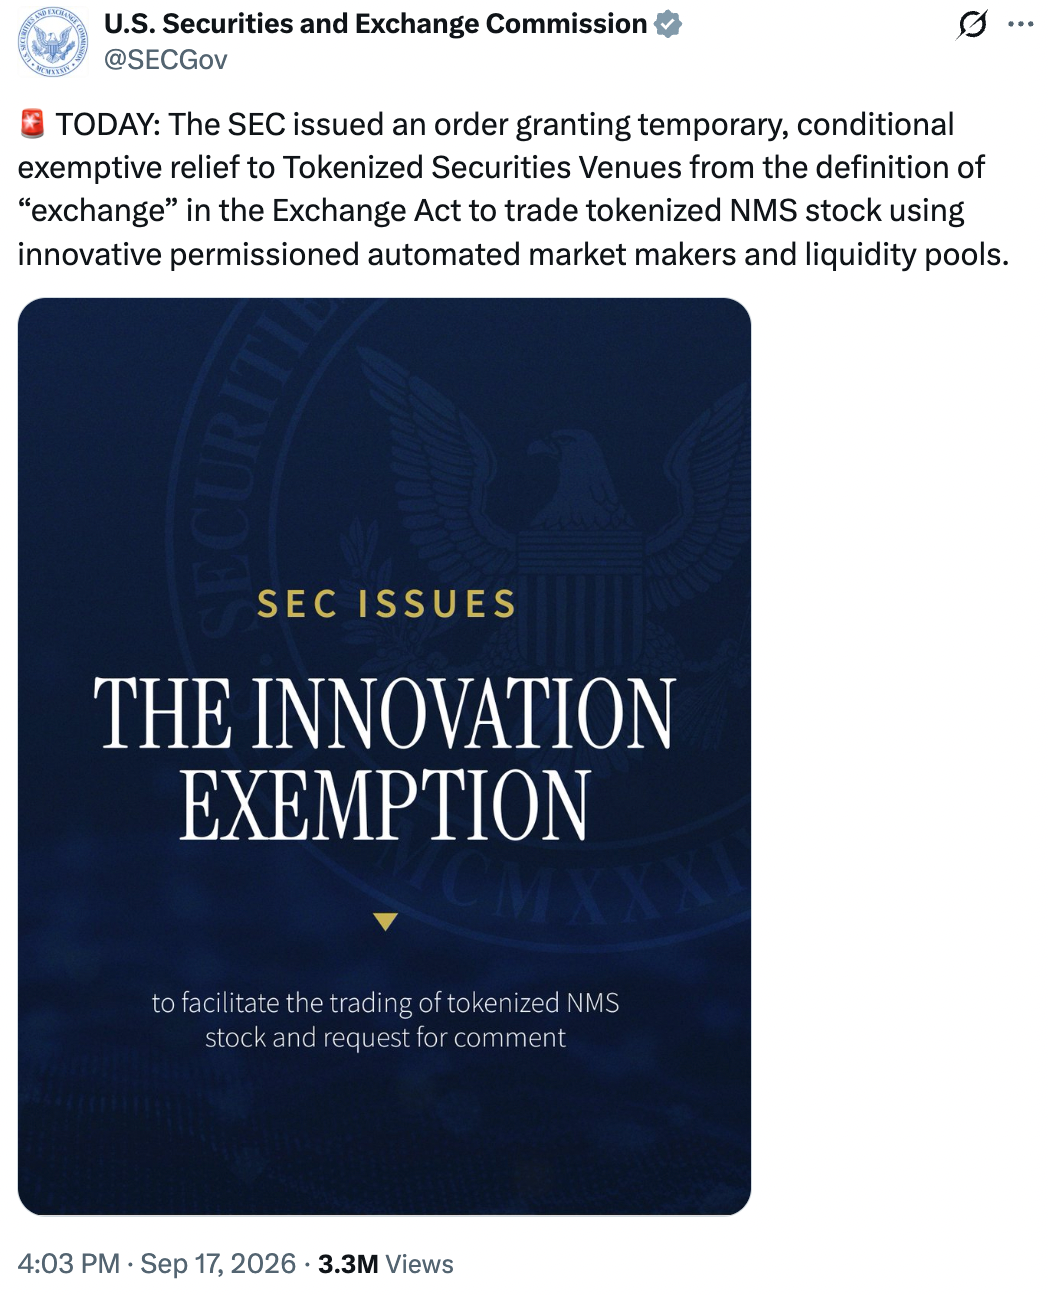
Source: Securities and Exchange Commission/X
The move by the SEC came two days after the Senate failed to advance the CLARITY Act in a 49-50 procedural vote, leaving the industry without the comprehensive federal market-structure framework it had been seeking. The SEC exemption is not a replacement for legislation, but it provides a temporary regulatory pathway for a defined part of on-chain securities trading. The exemption expires after five years and includes conditions covering investor rights, issuer objections, trading limits, disclosures and smart-contract safeguards. The SEC described it as a temporary step while it considers longer-term rules.
That provided a fresh regulatory narrative as the market digested the Fed’s Sept. 16 quarter-point rate increase to a 3.75%-4.00% target range. The hike was the first since July 2023, and the Fed said inflation remained elevated. That backdrop is normally restrictive for speculative assets, making Bitcoin’s subsequent response notable.
The rally was also amplified by derivatives positioning. Bitcoin’s move above $85,000 on Sept. 21 was accompanied by the liquidation of $262.3 million of short positions in one hour, according to CoinGlass data. Total crypto liquidations in that hour reached $271.83 million.
At the time of writing, the total liquidations stood at $789.6 million liquidated over 24 hours, with shorts accounting for $665.85 million. Bitcoin accounted for $431.86 million of the total short liquidations, while $183.56 million in ETH shorts were wiped out over the last 24 hours.
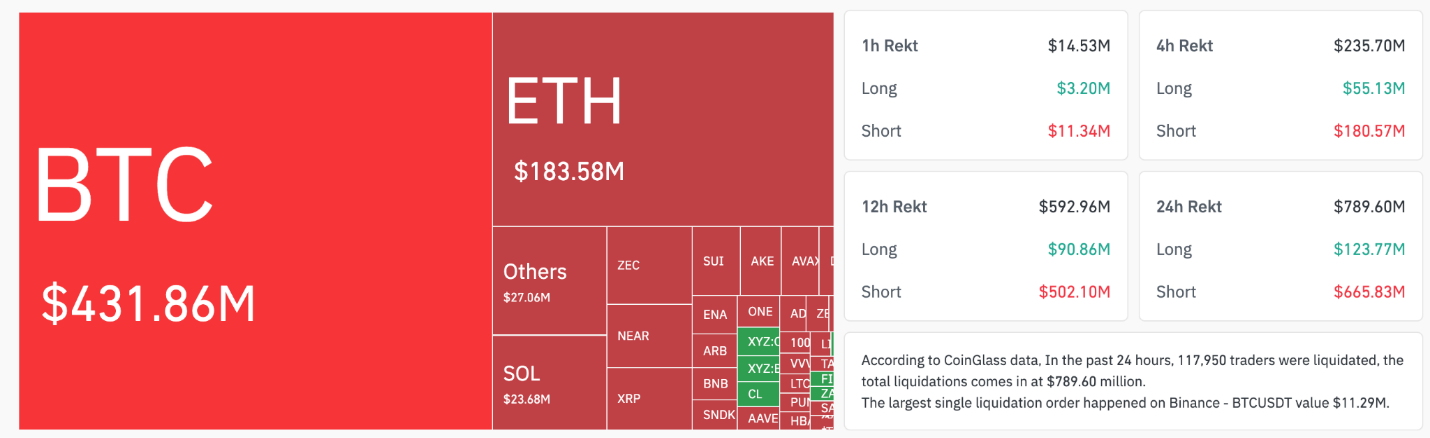
Total crypto liquidations. Source: Gassnode
Forced short covering can accelerate an upside move because liquidated shorts become buyers as positions are closed. Bitcoin’s move through the $80,000-$83,000 area, therefore, reflects both improving spot sentiment and a derivatives-driven squeeze.
Additional data from CoinGlass showed an 8% increase in Bitcoin’s futures open interest (OI) over the last 24 hours across all exchanges. The climb was more pronounced on BingX and Bitunix, whose Bitcoin OI has risen by 132% and 15% over the last 24 hours, respectively.
Even though futures longs (buyers) and shorts (sellers) are always matched, rising OI suggests increased leverage and market participation, potentially signaling stronger bullish sentiment.
For example, a 30% increase in OI between April 29 and May 6 was accompanied by a 10% rise in BTC price.
Meanwhile, US-based spot exchange-traded funds (ETFs) flipped to heavy inflows, indicating renewed institutional interest. These ETFs have recorded inflows over the last two days, totaling $593. The $433 million in net inflows recorded on Wednesday marked the largest investment since Sept.9.
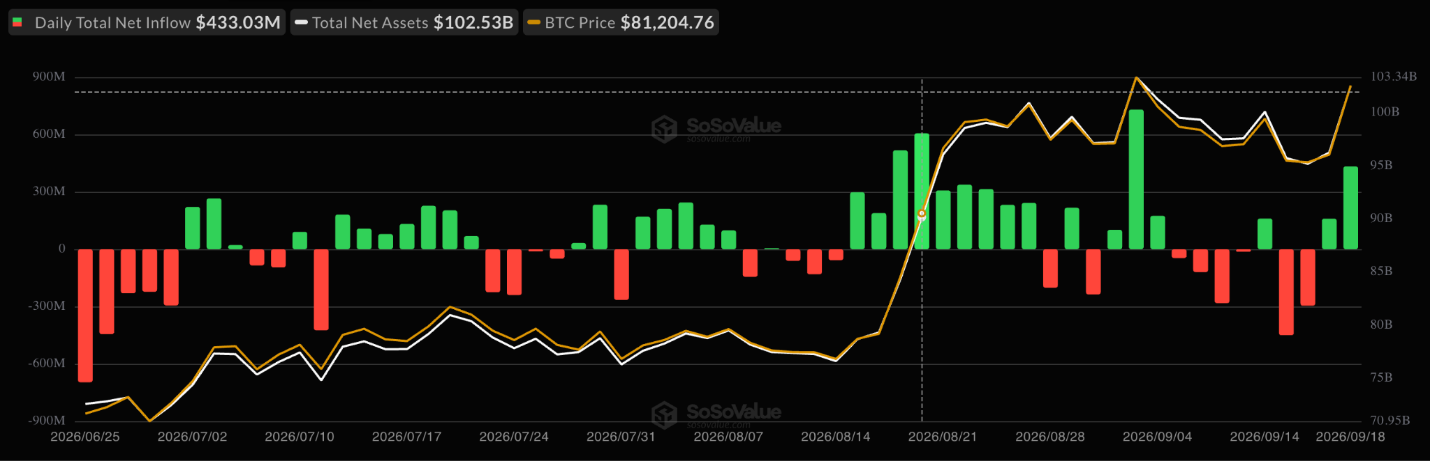
Spot Bitcoin ETF flows chart. Source: SoSoValue
Bitcoin’s 50-Week SMA Reclaim Puts the Trend in Focus
Two technical developments back Bitcoin’s upward outlook. First, Bitcoin reclaimed its True Market Mean at $76,660, an on-chain cost-basis model representing the average price paid by active investors for coins acquired on secondary markets. Glassnode calculates it from Investor Capitalization and Active Supply and describes it as a market-wide cost-basis anchor.
“$BTC has reclaimed the True Market Mean. That puts price back above a crucial level and back into a bullish regime,” onchain data provider Glassnode said in a recent post on X, adding:
“Next major overhead is the corporate treasury cost basis, around $80K and finally the ETF cost basis at $85K.”
Bitcoin has since moved through the corporate treasury cost basis and is currently testing the ETF realized price.
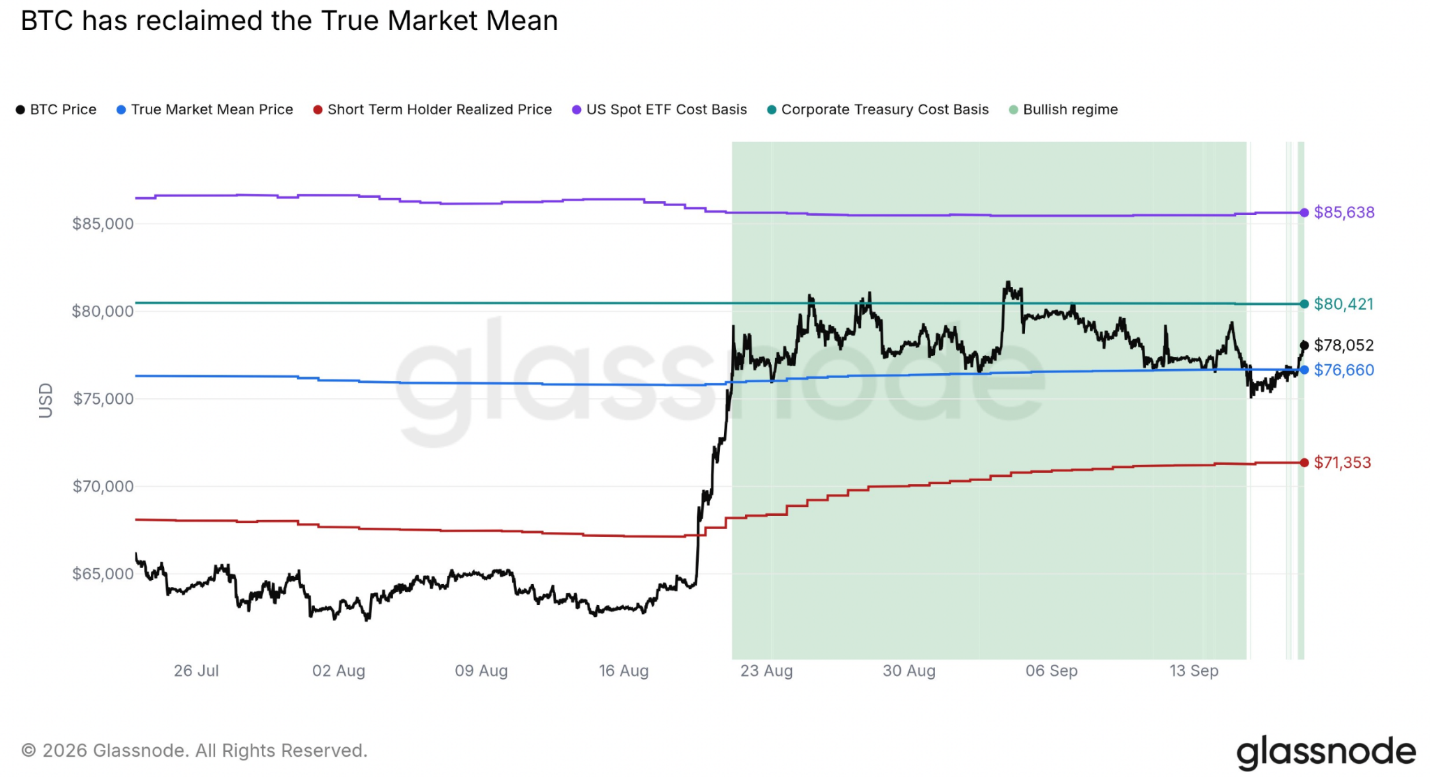
Bitcoin True Market Mean. Source: Glassnode
The significance of the reclaim is that active investors move from an aggregate unrealized-loss position toward profit as price rises above their cost basis. Glassnode’s AVIV framework similarly treats readings above 1 as aggregate unrealized profit. Holding above the mean can therefore improve market structure by reducing pressure from loss-making holders and shifting attention to higher cost-basis resistance.
The second signal is the 50-week simple moving average (SMA), currently at $78,180. Bitcoin closed the week of Sept. 20 at $81,159, its first weekly close above the 50-week average in 45 weeks, according to data from CoinMarketCap and TradingView. The last time the BTC/USD produced a weekly close above the trendline was on Nov. 9, 2025.
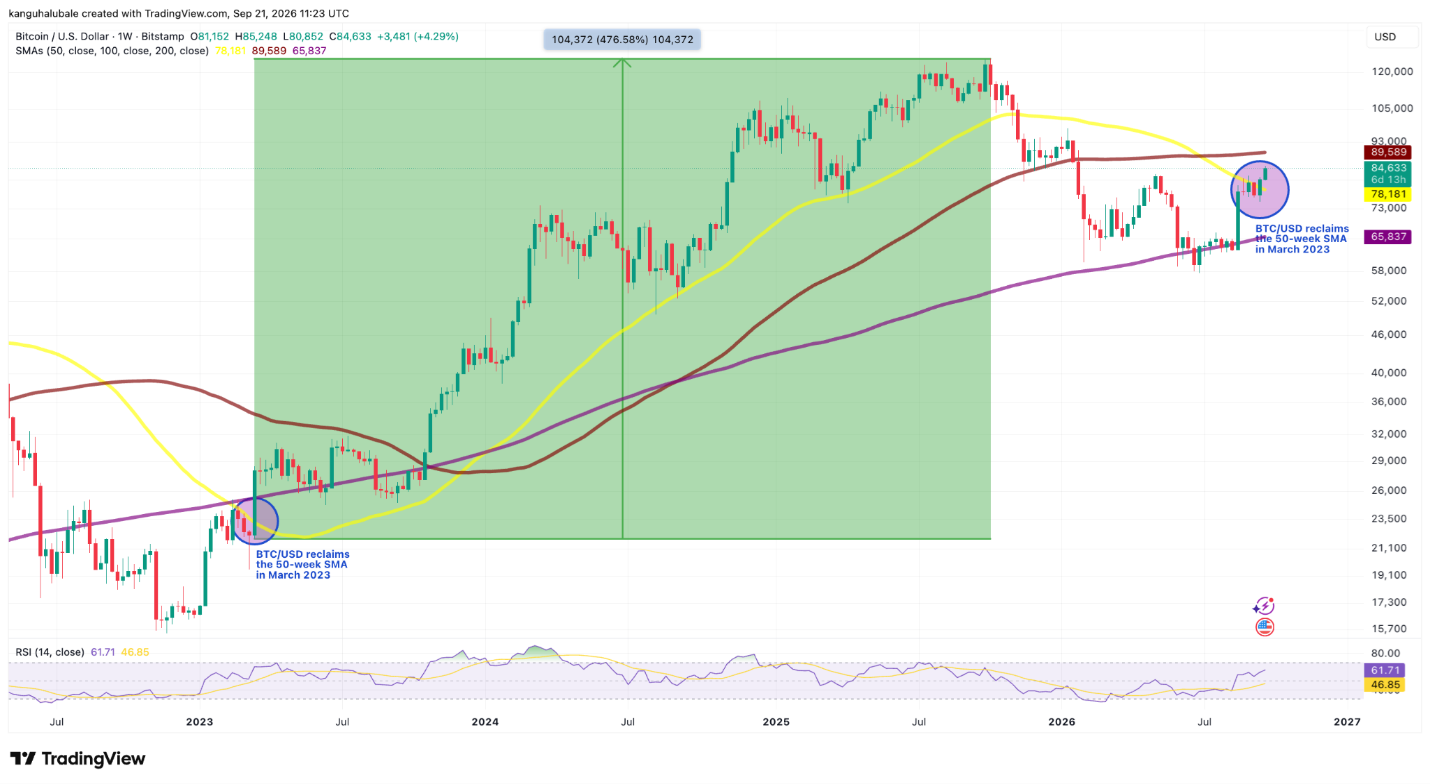
BTC/USD weekly chart. Source: TradingView
Historically, Bitcoin’s climb above the 50-week SMA usually marks the beginning of a new bull run. The chart above reveals that when this happened in March 2023 after the 2022 bear-market low, the BTC/USD pair went on to rally 476.58% from roughly $23,500 to its current all-time high of $126,000.
While this does not establish that the same percentage gain will repeat, it explains why a sustained reclaim is closely watched as a possible regime change signal.
If BTC/USD closes this week above the 50-week SMA again, it would be a signal confirming long-term trend reference rather than an intraday break. Galaxy Research’s Alex Thorn has also highlighted that reclaiming the 50-week SMA has “historically served as strong confirmation that bear market lows are in,” while other analysts caution that one weekly close alone does not confirm a new bull market.
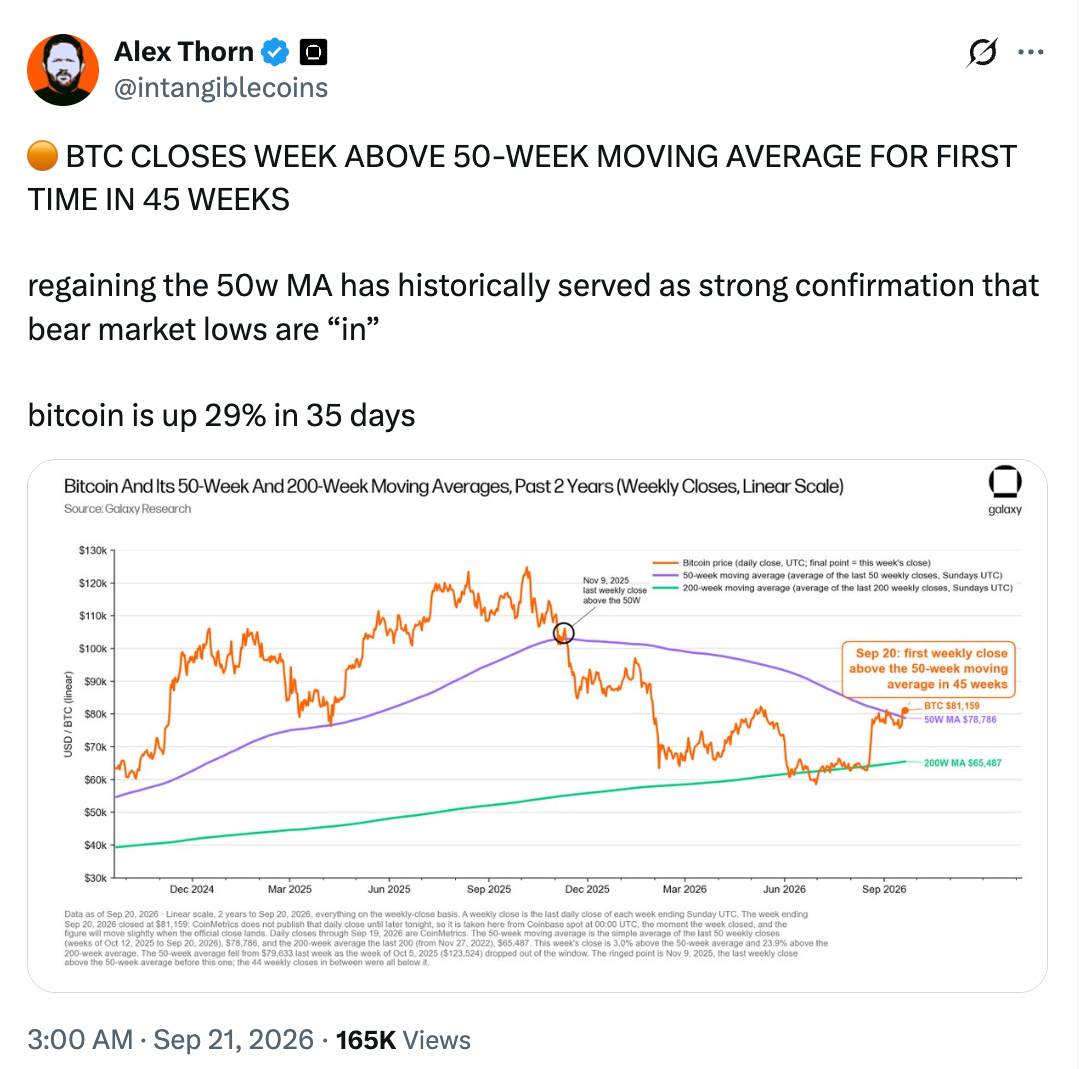
BTC/USD chart vs. its 50-week SMA. Source: Alex Thorn/X
What would Confirm Bitcoin’s Trend Change
Bitcoin now needs to convert the breakout into sustained support. The first requirement is a continued hold above the 50-week SMA, currently in the low-$78,000 area. A weekly close back below it would weaken the breakout, while repeated closes above it would make the level a more credible support zone.
The True Market Mean also needs to remain below price. If BTC holds above that active-investor cost basis while the corporate treasury level around $80,421 and ETF cost basis near $85,638 are absorbed, the market would show successive investor cohorts moving into profit rather than selling into resistance.
Momentum must also be supported by real demand. ETF flows, spot buying, stablecoin liquidity and corporate accumulation would provide stronger confirmation than derivatives-driven gains alone. The recent short liquidations accelerated the rally, but forced buying is temporary; a full bull-cycle transition requires buyers to keep absorbing supply after the squeeze fades.
Macro conditions remain a constraint. The Fed has raised rates to 3.75%-4% and officials continue to emphasize elevated inflation, while the SEC exemption does not replace comprehensive legislation. For the rally to develop into a broader trend change, BTC needs to hold its reclaimed technical levels, maintain positive demand and absorb the remaining regulatory and macro uncertainty.
Ready to trade our analysis of Bitcoin? Here’s our list of the best MT4 crypto brokers worth reviewing.