


Bullish view
Buy the BTC/USD pair and set a take-profit at 90,000.
Add a stop-loss at 83,000.
Timeline: 1-2 days.
Bearish view
Sell the BTC/USD pair and set a take-profit at 83,000.
Add a stop-loss at 90,000.
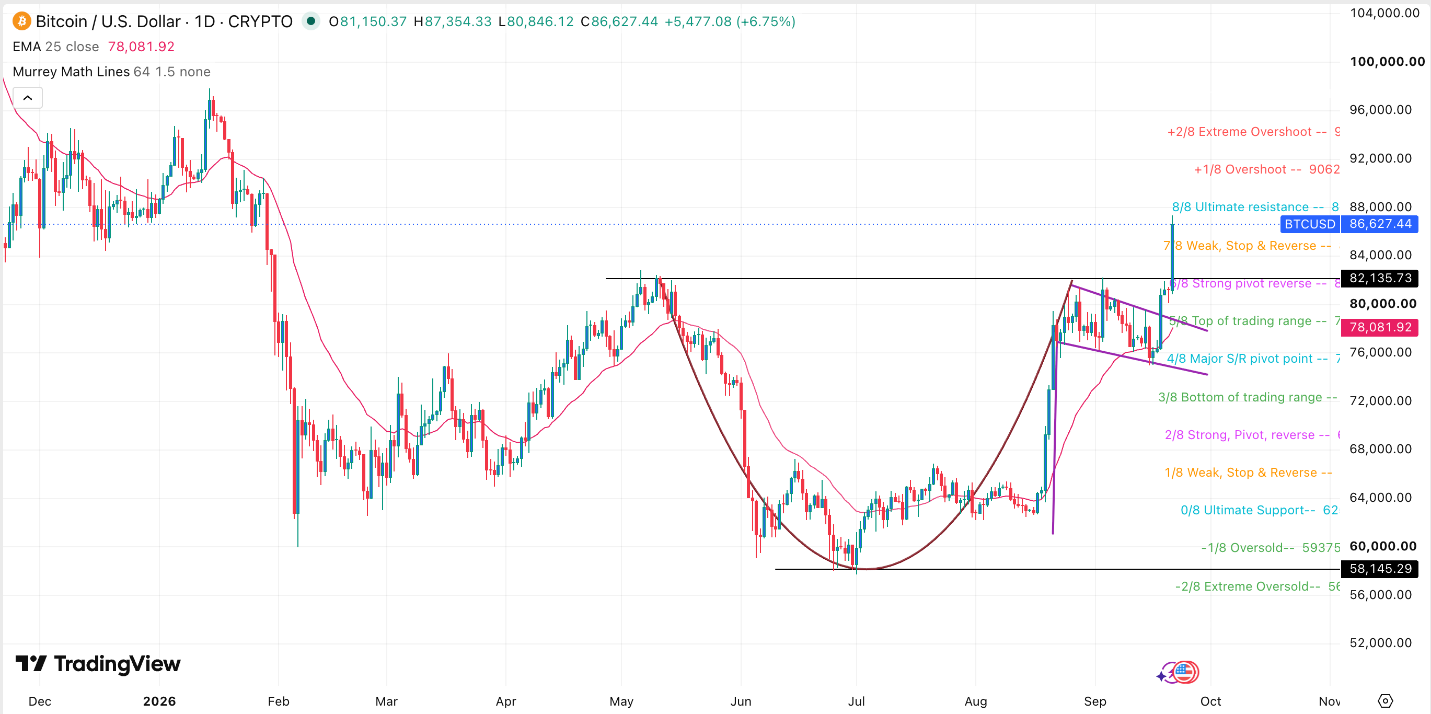
Bitcoin price made a strong bullish breakout, reaching its highest level since January this year. The BTC/USD pair jumped to 87,000, up by 50% from its lowest level this year.
Bitcoin jumped as investors embraced a risk-on sentiment as crude oil prices dropped below the crucial $100. Oil retreated as investors waited for potential talks between the US and Iranian leaders at the UN General Assembly. Trump has said that he would be willing to meet with Iran’s president, though it is unclear whether this meeting will happen.
Gulf leaders are also considering talking directly and reaching deals with Iran. In statements this week, leaders from countries like Qatar, UAE, and Saudi Arabia said that they would consider a new security architecture in the region.
These leaders have noted that their reliance on US security has failed. They have also understood the strength of Iranian military. If a deal is reached, these countries will likely strike major deals with Iran and possibly reopen the Strait of Hormuz, leading to lower oil prices.
Top Regulated Brokers
The BTC/USD pair also soared as investors rotated to risky assets. In the United States, the Dow Jones, Nasdaq 100, and S&P 500 indices surged by over 1%, with most companies being in the green. This includes top companies like Nvidia, Micron, and Microsoft.
The Crypto Fear and Greed Index has remained in the green, while American investors have continued buying Bitcoin ETFs. They have made over $500 million in purchases this month, bringing the last three months’ inflows to nearly $5 billion.
BTC/USD Technical Analysis
The daily chart shows that the BTC price bottomed at $58,145 in July and then started a slow upward trend. It jumped and hit a crucial resistance level of $82,135. This was an important level since it coincided with the highest level in May this year.
A closer look shows that the BTC/USD pair has formed a cup-and-handle pattern. It recently formed a handle section. At the same time, it formed a bullish flag pattern, which normally leads to a bullish breakout.
Therefore, the most likely scenario is where the BTC/USD pair continues rising as bulls target the overshoot level of 90,600. The alternative scenario is where it drops and retests the support at 82,000 and then resume the uptrend.
Ready to trade our free Forex signals? Here are the best MT4 crypto brokers to choose from