


Markets are starting to see a stronger recovery in risk sentiment this week, and it is looking more convincing by the minute. Risk sentiment can have a major impact upon the behaviour of this currency pair. This is putting the AUD/USD currency pair in focus, and we have seen some interesting technical developments over the past few days, and especially this morning, in the price chart. Let’s look at the two currencies first.
AUD/USD Fundamental Analysis
The Australian Dollar retains a cautiously bullish fundamental outlook, supported by renewed expectations of RBA tightening and stronger-than-expected Chinese growth. Deputy Governor Andrew Hauser’s warning that inflation could exceed the bank’s forecasts strengthens the case for another rate increase, potentially improving the Aussie’s interest-rate appeal. Meanwhile, China’s 4.5% annual third-quarter growth provides a favourable backdrop for Australian export demand, although cooling domestic employment could limit the RBA’s appetite for further tightening.
Top Regulated Brokers
The US Dollar has a mixed fundamental outlook, with persistent inflation supporting restrictive Federal Reserve policy but reduced expectations of an immediate rate hike limiting its upside. Stronger-than-expected September consumer and producer inflation strengthened the case for further tightening before year-end, yet cautious Fed commentary and retreating Treasury yields have weakened the dollar’s near-term momentum. Geopolitical tensions continue to provide a potential source of safe-haven demand, helping cushion the currency against those pressures.
It looks like fundamentals are moving towards supporting a more bullish case in this currency pair.
AUD/USD Technical Analysis
The price chart’s standout recent technical feature is the bullish breakout above the former resistance level just above 0.7000, and the price action seems to have now flipped this level to act as support – a classic sign of a successful breakout which is likely to hold.
This comes after the bullish double bottom at 0.6900 a few days ago. Note also how the price action since the low has been cleanly held within the ascending linear regression analysis (price channel) drawn as a study within the chart.
The price has reached a new three-week high and shows signs of continuing on to 0.7042 where the next resistance level sits.
A long trade from any bounce off the nearest support level just above 0.7000 is attractive.
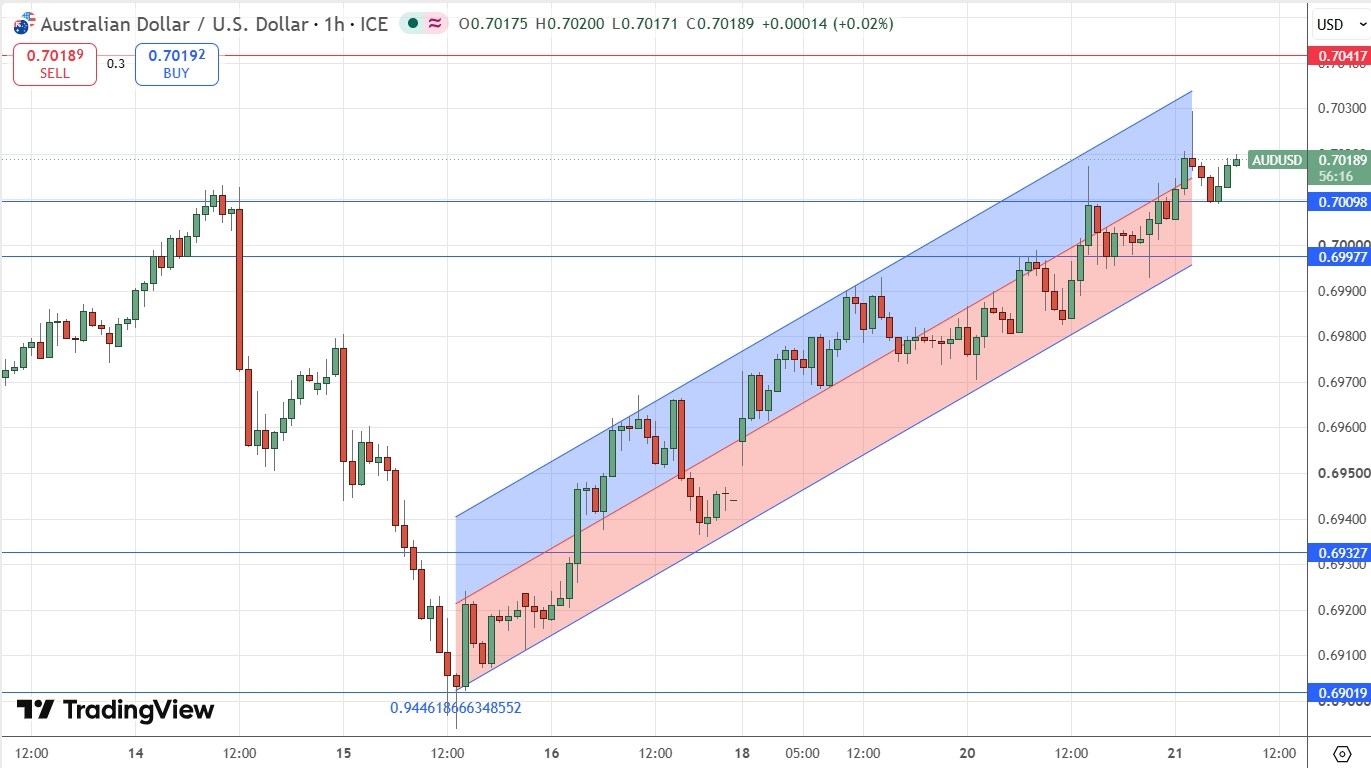
AUD/USD H1 Price Chart – Bullish Breakout
Support & Resistance Levels
My previous AUD/USD signal on 20th October might have produced a short trade from the bearish rejection of 0.7011, which would have been a losing trade.
Risk 0.25%.
Trades may only be entered prior to 5pm Tokyo time Thursday.
Short Trade Idea
Short entry following a bearish price action reversal on the H1 time frame immediately upon the next touch of $0.7042.
Place the stop loss 1 pip above the local swing high.
Adjust the stop loss to break even once the trade is 20 pips in profit.
Take off 50% of the position as profit when the price reaches 20 pips in profit and leave the remainder of the position to ride.
Long Trade Ideas
Long entry following a bullish price action reversal on the 1H1 time frame H1H1H1 time frame immediately upon the next touch of $0.7010, $0.6998, or $0.6964.
Put the stop loss 1 pip below the local swing low.
Move the stop loss to break even once the trade is 20 pips in profit.
Remove 50% of the position as profit when the price reaches 20 pips in profit and leave the remainder of the position to ride.
The best method to identify a classic “price action reversal” is for an hourly candle to close, such as a pin bar, a doji, an outside or even just an engulfing candle with a higher close. You can exploit these levels or zones by watching the price action that occurs at the given levels.
There is nothing of high importance scheduled today regarding either the Australian or US Dollars.
Ready to trade our free Forex signals? Here is our list of the top Forex brokers worth reviewing.