


Bearish view
Sell the GBP/USD pair and set a take-profit at 1.3100.
Add a stop-loss at 1.3300.
Timeline: 1-2 days.
Bullish view
Buy the GBP/USD pair and set a take-profit at 1.3300.
Add a stop-loss at 1.3100.
The GBP/USD pair has remained under pressure after the Federal Reserve minutes of the last meeting. It dropped to 1.3212 as investors rushed to the safety of the US dollar as global bond yields surged.
Top Regulated Brokers
US Dollar Index Rally Continues
The GBP/USD pair retreated after the Federal Reserve published minutes of the last meeting. These minutes showed that most officials supported hiking interest rates at the time. More officials also hinted that they will support another hike this year to tame the rising inflation.
Still, things have changed since that meeting. The most recent data showed that inflation continued to soften in August. Another report showed that the labor market was not as strong as analysts were expecting. As such, market participants now expect the bank to leave rates unchanged in this month’s meeting and then hike in December.
The GBP/USD pair dropped as the US dollar rally gained momentum. It jumped to 102.5 and is hovering near its highest level since April 7 this year. The dollar’s rally coincided with the surge in global bond yields. In the US, the ten and 30-year yields rose to 5.32% and 5.70%, respectively.
The same surge is happening in the UK, where the ten-year yield jumped to 4.45%, its highest level since October 1. These yields are rising because of the ongoing weakness of the UK and US economies and the rising energy prices. Brent and WTI have continued rising this month.
There will be no major macro data from the UK and the US today. The only data to watch will be the upcoming US initial and continuing jobless claims. While important, the weekly report rarely move the market.
GBP/USD Technical Analysis
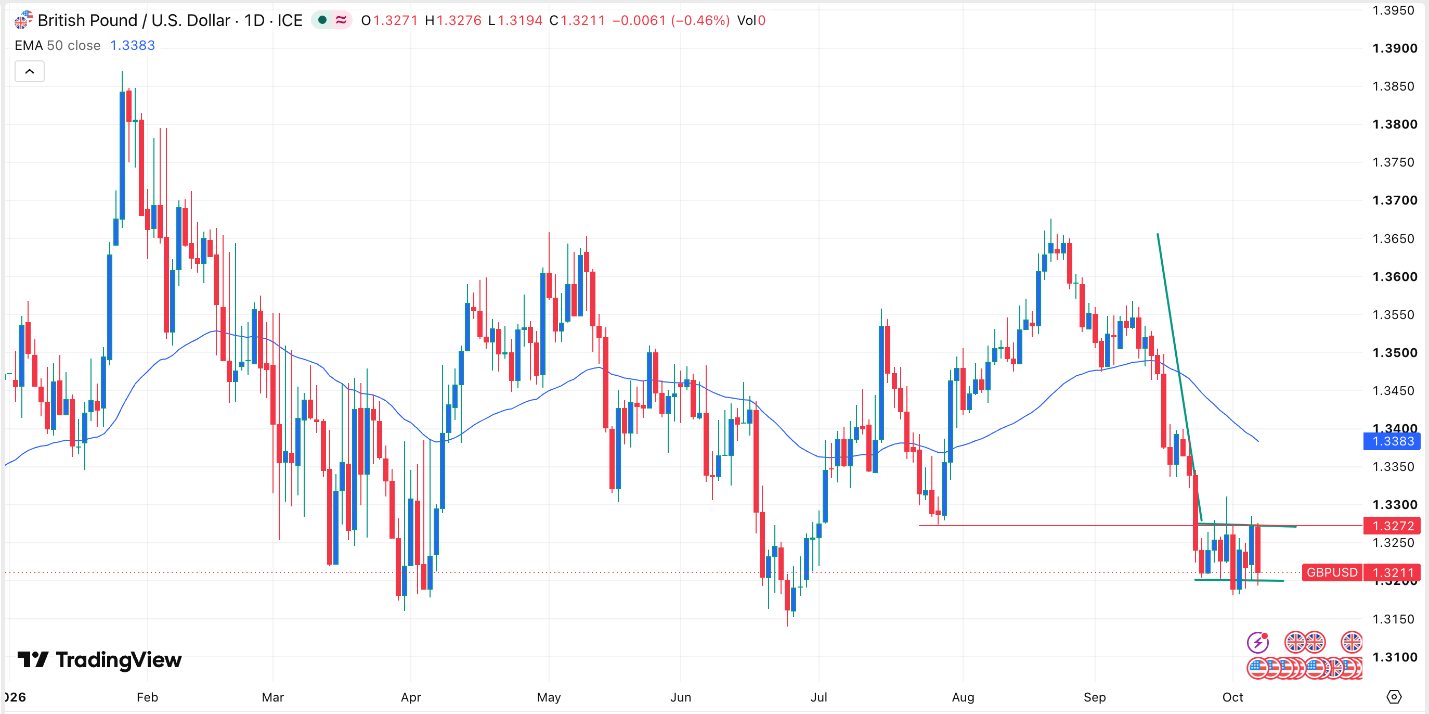
The daily chart shows that the GBP/USD pair has moved sideways in the past few days. It has formed a horizontal channel, which started after it dropped sharply between August 21 and October 1. This channel is part of the bearish flag pattern, a common continuation sign in technical analysis.
The pair remains below the crucial support level of 1.3272, its lowest level on July 28. It is also below the 50-day moving average. Therefore, the path of least resistance is lower, with the next important level to watch being at 1.3100.
Ready to trade our free trading signals? We’ve made a list of the best UK forex brokers worth using.