


Fundamental Backdrop and Market Sentiment
I wrote on 4th October that the best trades for the week would be:
Long of the S&P 500 Index following a daily close above 7803. This set up on Wednesday and ended the week lower by 0.20%.
Long of the NASDAQ 100 Index. This ended the week higher by 0.19%.
Short of the EUR/USD currency pair. This pair fell over the week by 0.45%.
Long of Bitcoin. This fell by 4.04% over last week.
Long of Ethereum. This fell by 8.10% over last week.
The total loss of 11.70% averages 2.34% per asset.
Top Regulated Brokers
A summary of last week’s most important data in the market:
FOMC Meeting Minutes – hawkish, reinforced the Fed’s tightening bias. Most participants thought another rate increase would probably be appropriate by year-end, while inflation risks remained tilted to the upside. Gave the USD a tailwind.
BoJ Governor Ueda Speaks - Ueda reiterated that the BoJ would continue raising interest rates as economic and inflation conditions warranted. Mildly hawkish, may have prevented the JPY from falling further.
Canada Unemployment Rate and Employment Change - Friday’s employment report was materially weaker than expected. Markets reduced expectations of a Bank of Canada rate increase: the implied probability of an October 28 hike fell from 40% before the release to 25% afterward. This put a headwind against the CAD.
The USD remained a dominant theme in Forex last week, extending its winning streak as hawkish FOMC minutes reinforced expectations of further tightening. Elevated Treasury yields and persistent inflation concerns supported the greenback, while Canada’s unexpectedly sharp employment decline weakened the CAD by reducing expectations of a Bank of Canada rate hike. The broader macro backdrop remained uncomfortable: high energy prices kept inflation risks alive even as hiring and consumer confidence showed signs of weakening.
Stock markets proved more resilient than that backdrop might suggest. Despite midweek volatility and concerns over AI spending, all three major US indices finished higher: the S&P 500 gained 1.2%, the Dow 0.9%, and the Nasdaq 0.6%. Note that the tech-based NASDAQ 100 Index gave a much lower return, barely 0.19%, suggesting that tech may be starting to underperform the broader stock market. Optimism about the approaching earnings season helped equities withstand elevated borrowing costs, leaving investors balancing strong corporate-profit expectations against the risk that inflation could keep monetary policy restrictive.
The approaching November 3 US midterm elections added a political dimension to the inflation story, with high energy prices putting pressure on Trump and Republicans. Reports of possible renewed US strikes on Iran helped push Crude Oil sharply higher on Thursday, before Trump’s statement that no attack was planned before the elections eased immediate supply fears and helped sentiment recover on Friday. That reassurance remained fragile: Trump subsequently left open the possibility of earlier military action, while Brent ultimately settled above $104 a barrel, leaving the energy-driven inflation risk unresolved. I believe any military action before the mid-terms in the USA is extremely unlikely.
Crypto failed to sustain its attempted breakouts and lagged equities. Bitcoin repeatedly failed to reclaim $87,000 before falling toward $80,400, with a late recovery leaving it around $82,000–$83,000; Ether also finished materially lower, with a notably larger proportionate decline. Heavy ETF withdrawals accompanied the retreat, suggesting that early-October enthusiasm lacked sustained buying support. The week therefore showed a divergence rather than a uniform risk-off move: the dollar strengthened, stocks advanced on earnings optimism, and crypto struggled to maintain upside momentum.
The Week Ahead: Key Data and Events to Watch
Next week will see very few highly important data items. The coming week’s most important data points, in order of likely importance, are:
US CPI (inflation) – this is the most important event of all.
US PPI – this can influence the Fed’s perception of the strength of the US economy.
US Retail Sales – to a lesser extent, this can also influence the Fed.
UK GDP
Australia Unemployment Rate
It is a public holiday in the USA, Japan, and Canada on Monday.
Monthly Forex Forecast: October 2026 Overview
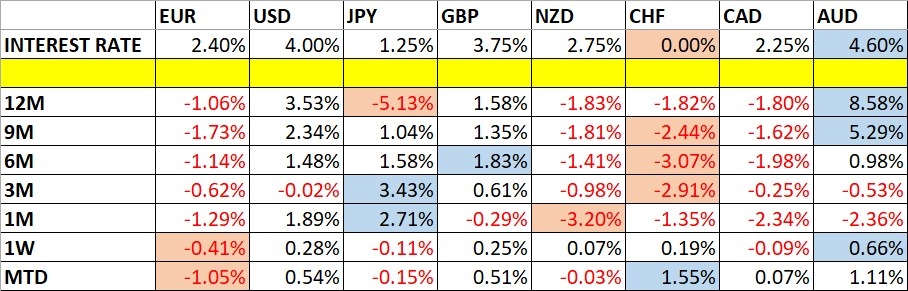
For the month of October, I forecast that the EUR/USD currency pair will decline in value. Here is the performance so far:

Weekly Forecast 11th October 2026
There were no excessive moves in currency crosses last week, so I make no forecast.
Volatility fell to an extreme low last week, with not one of the notable currency pairs and crosses moving by more than 1% in value. Next week’s volatility is likely to be notably higher.
You can trade these forecasts in a real or demo Forex brokerage account.
Technical Overview and Key Levels
Key Support and Resistance on Major FX Pairs
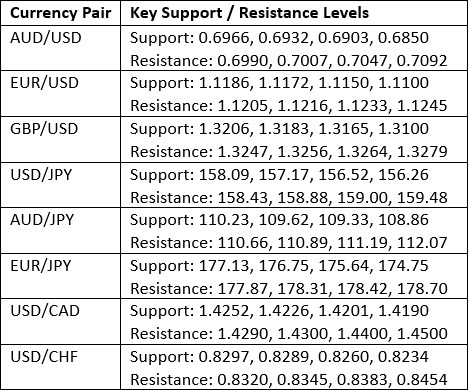
Key Support and Resistance Levels
US Dollar Index
The US Dollar printed a bullish candlestick last week, continuing its significant bullish technical breakout to a new 6-month high above the former resistance level at 101.39. There is no question the price is in a long-term bullish trend, and since the low a few months ago, we can see a wide ascending linear regression analysis is providing a symmetrical bullish price channel to direct the rise.
Despite these bullish factors, it is worth noting that the candlestick was relatively small and had a notable upper wick, which suggests that bullish momentum might be flagging.
It is quite likely that the next major move will hinge on this week’s release of US CPI (inflation) data which is overall the most important single item of data in the Forex market’s calendar. It will take place this Wednesday and is supposed to show a month-on-month CPI growth of 0.6% - if the number is larger, it will likely increase expectations of near-term rate hikes which would probably send the greenback higher.
I still think it makes sense to be prepared to be long of the USD this week, especially against the Euro, which has been breaking down to long-term lows against the Dollar.
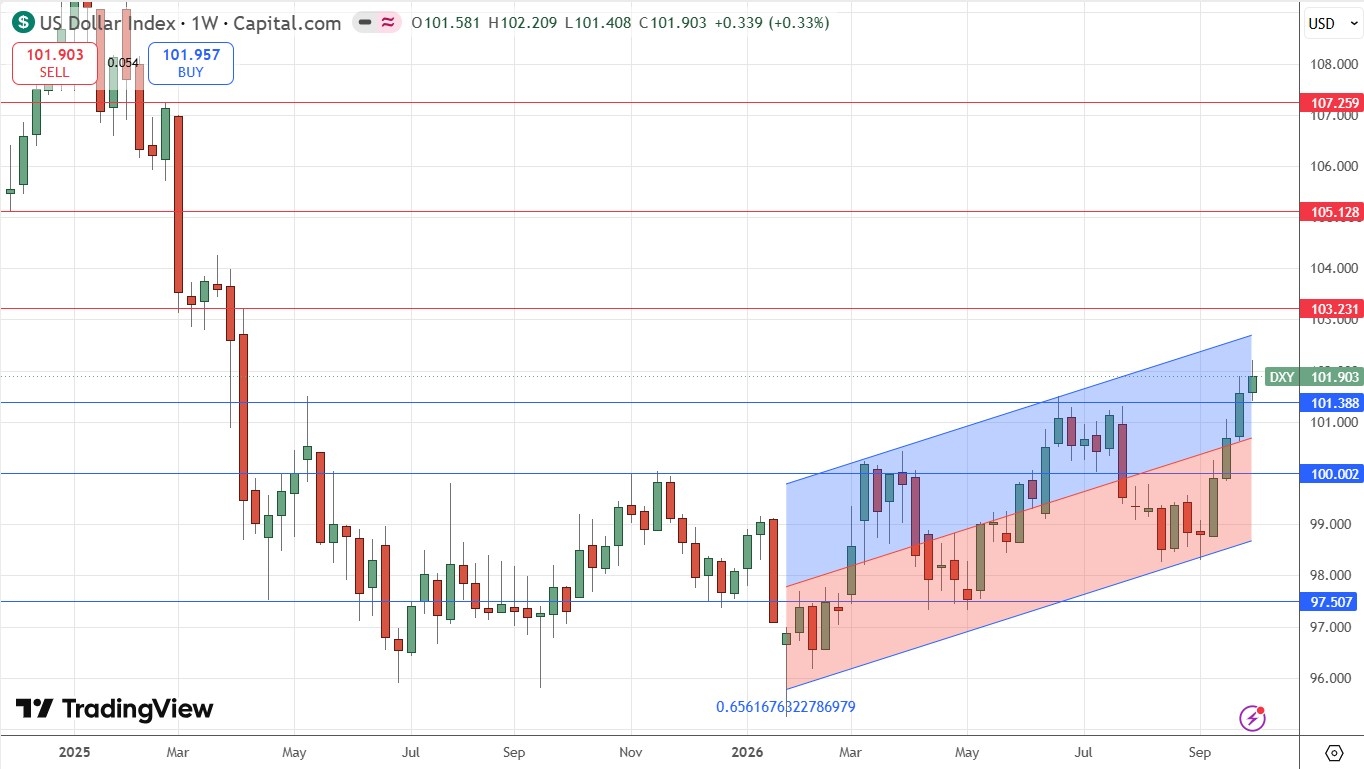
US Dollar Index Weekly Price Chart
EUR/USD
The EUR/USD currency pair fell again last week, making a significant technical bearish breakdown to a new 6-month low and trading below the 1.1200 handle before clawing back some of its losses towards the end of the week. Notably, the weekly candlestick was relatively small, and had a significant lower wick, which could suggest declining bearish momentum.
The euro weakened last week as concerns over France’s heavy public debt and political obstacles to budget cuts undermined confidence in eurozone assets. Higher oil prices added pressure.
The US dollar strengthened as Federal Reserve minutes highlighted inflation risks, reinforcing expectations of a hawkish policy stance. The relatively resilient US economy and Europe’s fiscal uncertainty also supported the greenback, with the dollar index gaining about 0.3% over the week.
This currency pair has historically tended to trend very reliably. It also likes to pull back within trends, so don’t be deterred by deep retracements, or by seeming drops in momentum as the chart shown now.
Note in the weekly price chart below, how there is a clear sequence of lower highs and lower lows, supporting a bearish interpretation.
It might be somewhat late to enter a new short trade now, but it is worth holding on to this short trade if you are already in it and using a trailing stop – I like to use three times the ATR (100) from the lowest daily close.
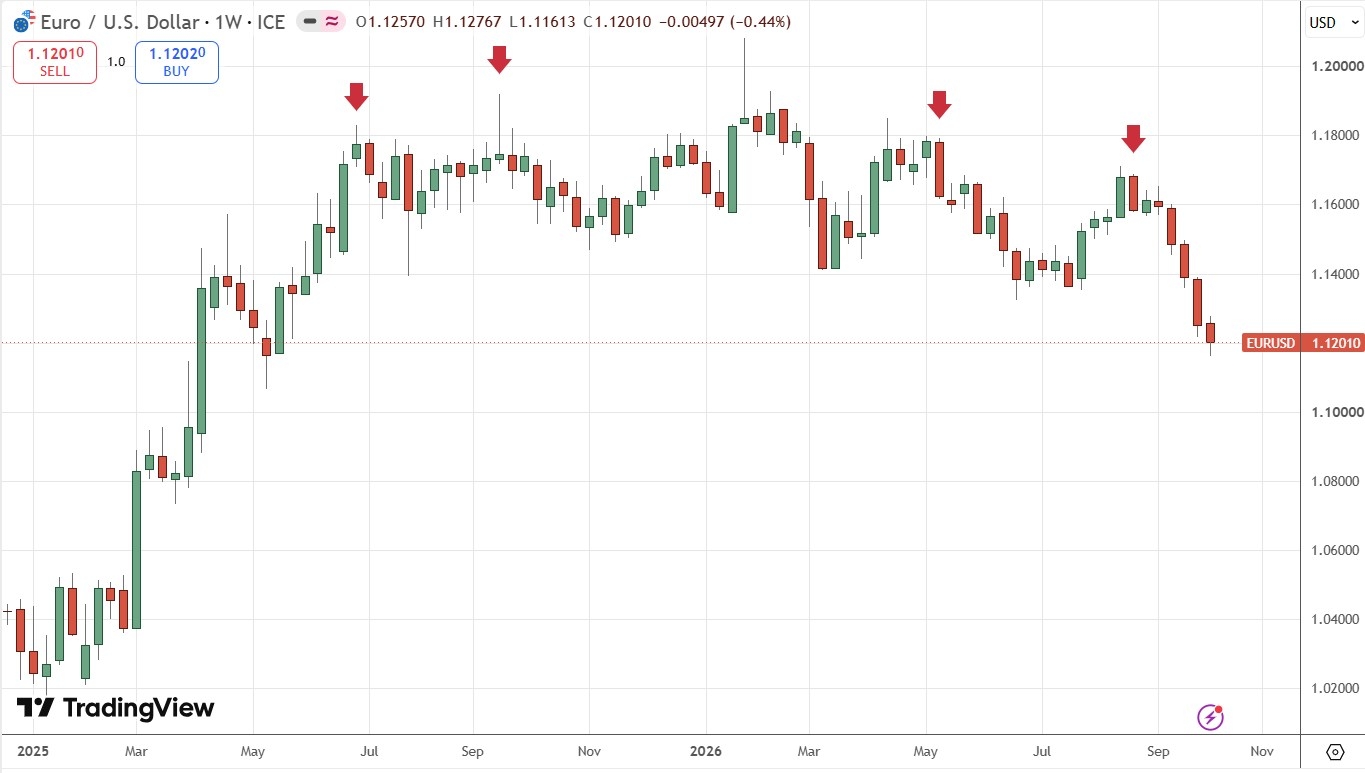
EUR/USD Weekly Price Chart
WTI Crude Oil
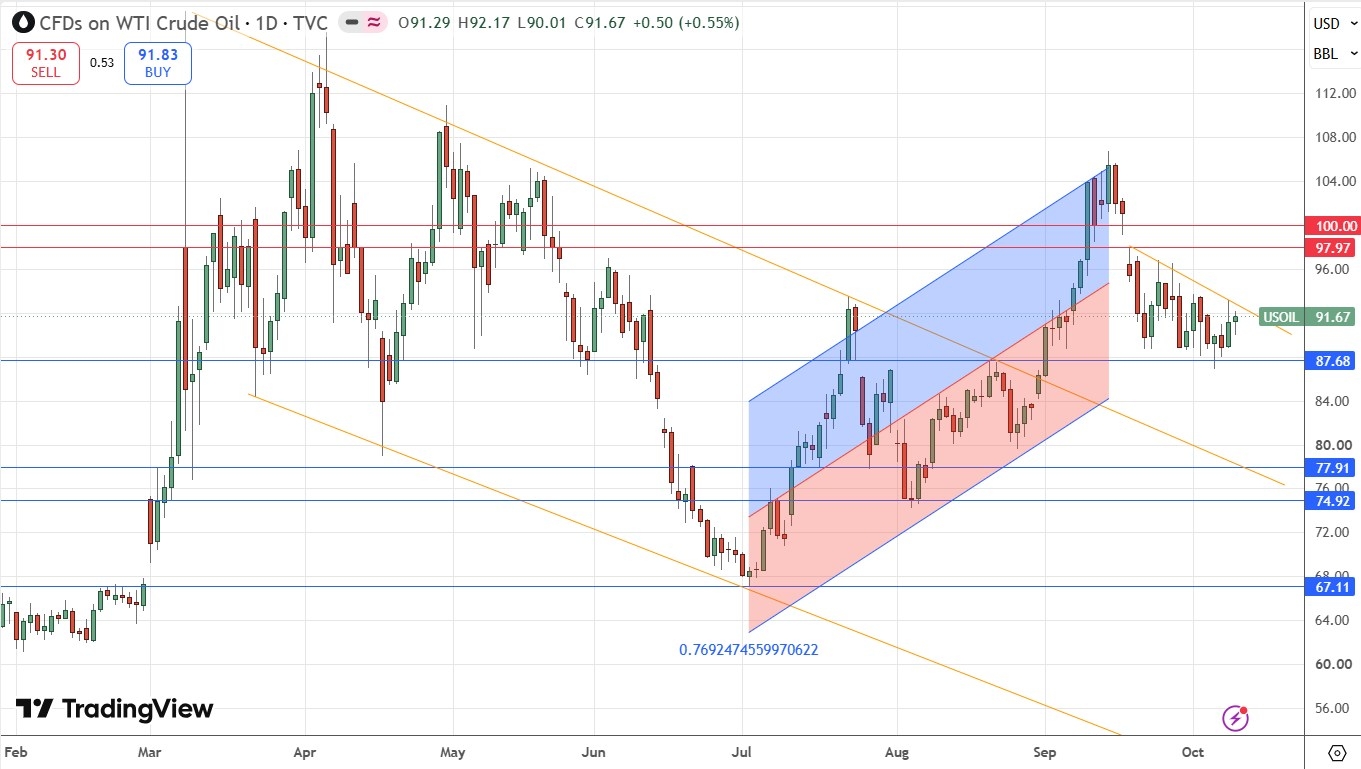
WTI Crude Oil has held up over the past week, basing off the key support level at $87.68 which I have been writing about recently as a potentially very important level. Note however that the price action has broken weakly below the supportive trend line of the ascending linear regression analysis, so we can disregard that and note that bullish momentum has weakened, at least for now.
There are two other technical features worth noticing here:
The descending trend line over the short-term since we saw a gap lower almost one month ago, which the price action is continuing to respect.
The gap between about $98.00 and $100.00 which is very confluent with the biggest round number you can see in Crude Oil, so it is likely to be strong.
As has been the case for many months, what happens militarily and geopolitically in the Strait of Hormuz and in the Gulf is the main driver here, making trading unpredictable. However, it might be becoming more predictable, because it is increasingly obvious President Trump will not launch serious attacks on Iran until after the mid-term US election is over on 4th November.
Before that time, I think it is very likely that the price here will consolidate between that $98.00 to $100.00 area above and $87.68 below, unless there is a major surprise like a sudden deal announcement between the USA and Iran, or a sudden major military attack by the USA or Israel upon Iran, or vice versa.
Longer-term traders might do well to look for buying opportunities if they think a resumption of the war is going to happen after the mid-terms, but they might need to be quick to take profit, as President Trump tends to make moves pretty quickly to bring down the price of Crude Oil once it exceeds $100.
WTI Crude Oil Spot Daily Price Chart
Bitcoin
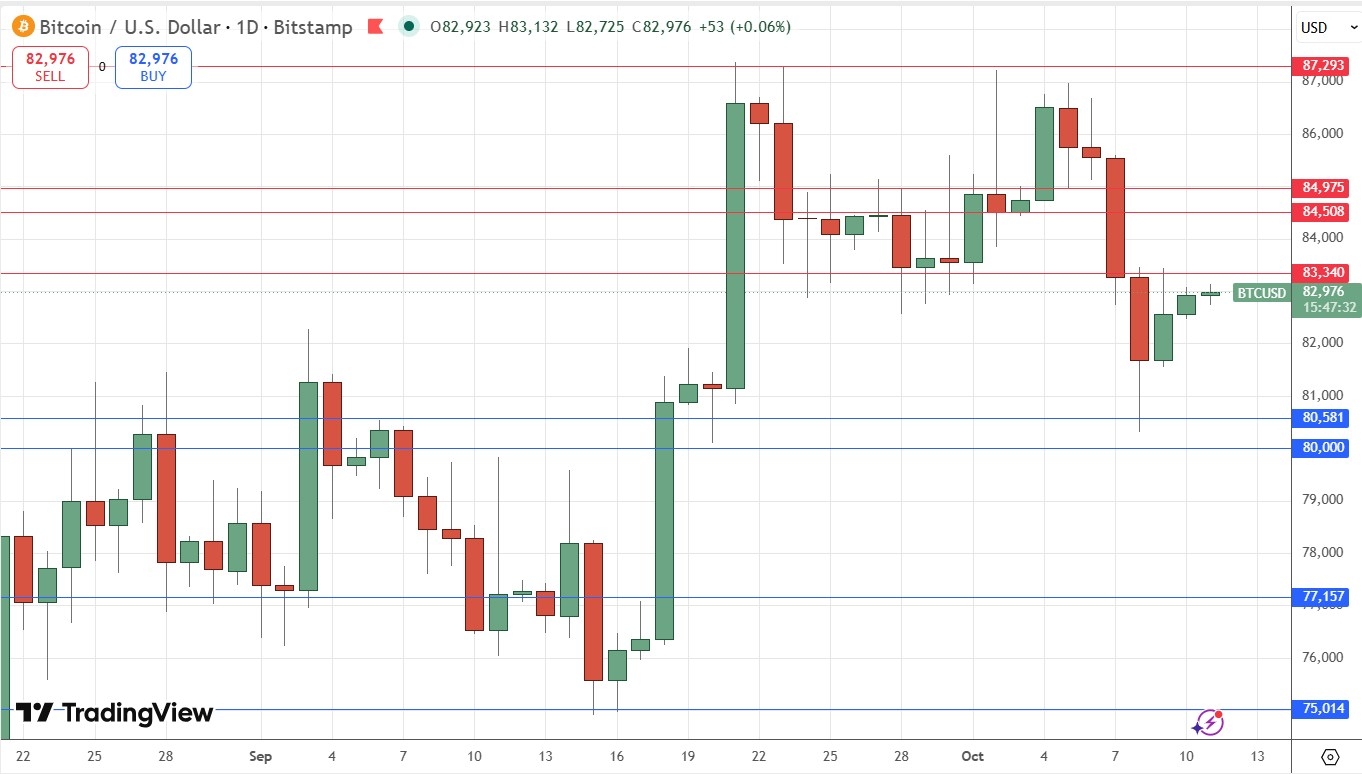
Bitcoin was coiling tightly just below very key resistance at $87,293 and Ethereum was following a similar pattern. A bullish breakout to new multi-month highs and a move higher for the wider crypto asset classes was in view. However, after a few failed tests of the area, the price has finally begun to move more decisively lower, invalidating $82,000 as support.
Despite this, the price has begun to recover meaningfully over today and yesterday, and the two support levels at and just above the big round number below at $80,000 are intact, so there is still hope that this bullish breakout will happen – it is just a fainter hope.
If we get a daily close below $80,000, I will see that as a bearish sign. A daily close above $87,293 and we could see the price move strongly higher quite quickly.
Bitcoin Daily Price Chart
S&P 500 Index
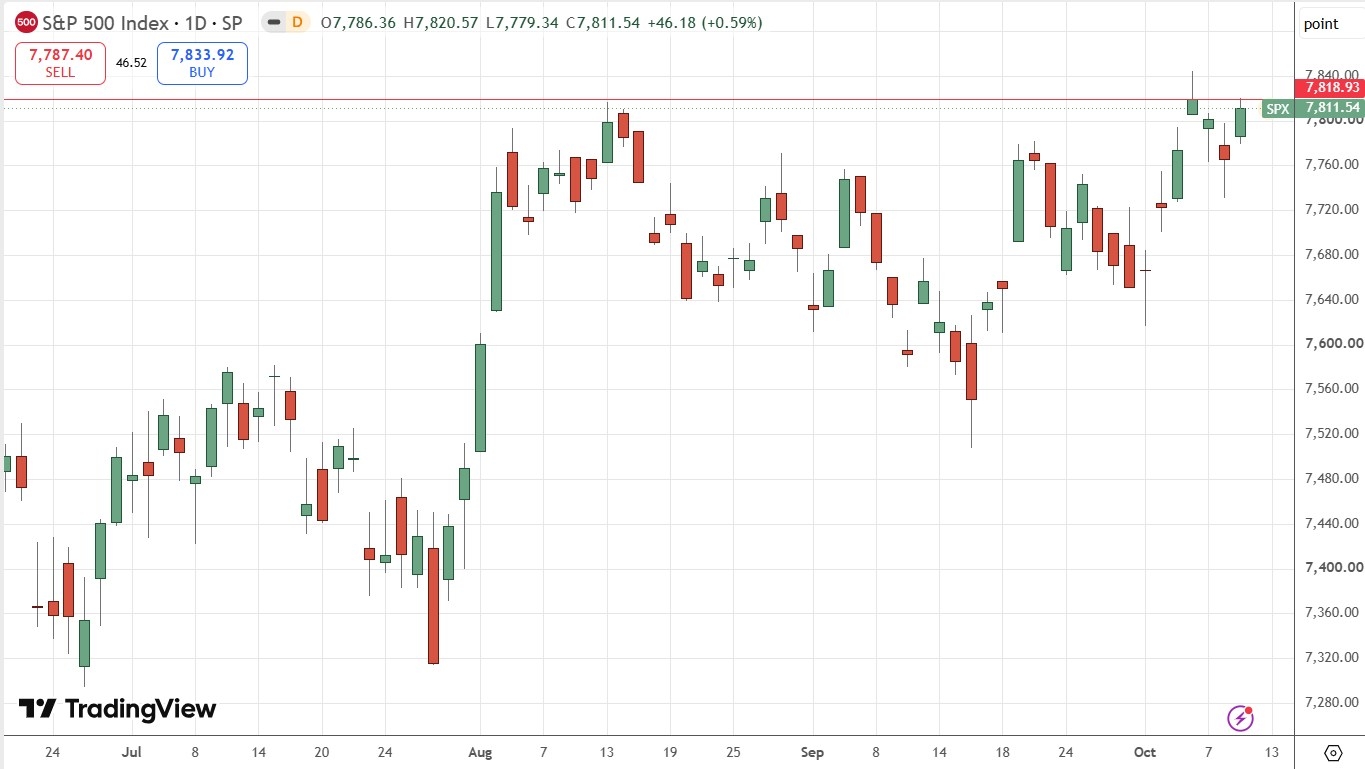
Last Tuesday saw the broad benchmark of the S&P 500 Index close at a new record high, before making a normal bearish retracement over the next couple of days, before ending the week by rising higher, but not quite far enough to recapture its high from early in the week.
A bullish breakout to new all-time high price is certainly a very bullish sign in this broad US stock market index, but it is worth noting that we have not really seen much of an advance in absolute terms for over the past two months now.
Despite this note of slowing momentum, US treasury yields at long-term high prices, and an annualized return of over 25%, it is not wise to write this Index off yet. The US stock market has historically shown a tendency to keep rising even when analysts start to say it shouldn’t.
As a trend trader, I am long here, but it would probably be wise for anyone looking to enter a new trade to wait for a new record daily close, which would be above 7819, before entering long.
S&P 500 Index Daily Price Chart
Bottom Line
I see the best trades this week as:
Long of the S&P 500 Index following a daily close above 7819.
Short of the EUR/USD currency pair.
Long of Bitcoin following a daily close above $87,293.
Ready to trade our weekly Forex forecast? Check out our list of the best Forex brokers.