
Long Trade Idea
Enter your long position between $211.42 (yesterday’s intra-day low) and $219.80 (yesterday’s intra-day high).
Market Index Analysis
Automated Data Processing (ADP) is a member of the NASDAQ 100 Index and the S&P 500 Index.
Both indices trade inside bearish chart patterns with rising bearish catalysts.
The Bull Bear Power Indicator of the NASDAQ 100 Index is bearish with a descending trendline.
Market Sentiment Analysis
Equity futures are lower as the announcement to release oil from the US and the IEA's strategic petroleum reserves failed to reverse the rally, which had receded from nearly $120, but has since reversed its slide after two oil tankers were attacked and oil terminals were suspended. Tomorrow’s February PCE will provide another reading on inflation, but before the surge in oil prices. Adobe and Dollar General will report earnings after the bell, potentially injecting volatility into Friday’s session.
Automated Data Processing Fundamental Analysis
Automated Data Processing is a human resources and management firm with an expanding global footprint. It is best known for its ADP employment report in the US, which precedes the official NFP report by 2 days.
So, why am I bullish on ADP following its breakout?
ADP has demonstrated earnings excellence, beating estimates in the last 17 quarters. I am bullish about its AI-driven Lyric HCM, which accounts for over 70% of future bookings, and Workforce Now NextGen products, which are gaining traction with clients. ADP has pioneered agentic AI in human resources, and I believe it will further capitalize on its market position. I am equally bullish about its recurring, resilient business model with high customer retention.
Metric | Value | Verdict |
P/E Ratio | 20.44 | Bullish |
P/B Ratio | 13.42 | Bearish |
PEG Ratio | 2.74 | Bearish |
Current Ratio | 1.03 | Bearish |
ROIC-WACC Ratio | Positive | Bullish |
Automated Data Processing Fundamental Analysis Snapshot
The price-to-earnings (P/E) ratio of 20.44 indicates ADP is an inexpensive stock. By comparison, the P/E ratio for the NASDAQ 100 Index is 36.53.
The average analyst price target for ADP is $272.00, suggesting excellent upside potential with decreasing downside risks.
Automated Data Processing Technical Analysis
Today’s ADP Signal
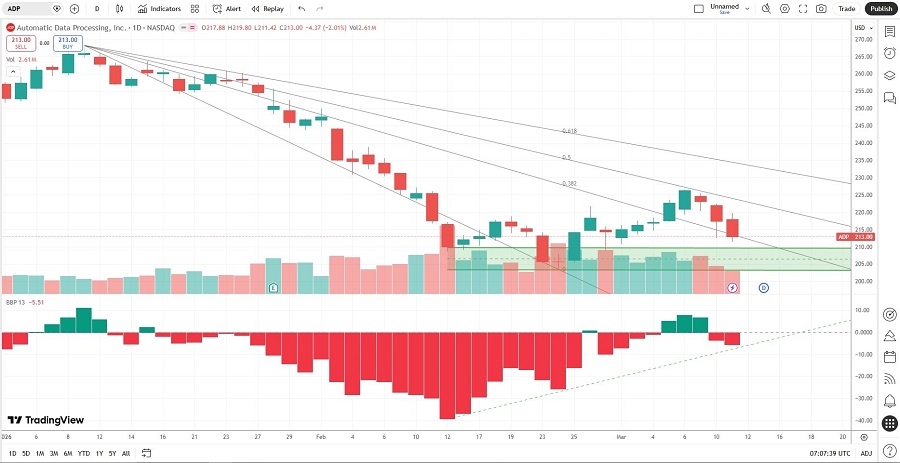
Automated Data Processing Price Chart
The ADP D1 chart shows price action breaking out above its horizontal support zone.
It also shows price action between its descending 38.2% and 50.0% Fibonacci Retracement Fan levels.
The Bull Bear Power Indicator turned bearish with an ascending trendline.
The average bullish trading volumes are higher than the average bearish trading volumes.
ADP drifted higher as the S&P 500 Index corrected, a significant bullish confirmation.
My ADP Long Stock Trade
ADP Entry Level: Between $211.42 and $219.80
ADP Take Profit: Between $260.65 and $268.08
ADP Stop Loss: Between $187.29 and $192.26
Risk/Reward Ratio: 2.04
Ready to trade our analysis of Automated Data Processing? Here is our list of the best stock brokers worth reviewing.