
Long Trade Idea
Enter your long position between $86.72 (the lower band of its horizontal resistance zone) and $90.17 (the upper band of its horizontal resistance zone).
Market Index Analysis
Medtronic (NYSE:MDT) is a member of the S&P 100 Index and the S&P 500 Index.
Both indices trade inside bearish price channels as downside catalysts accumulate.
The Bull Bear Power Indicator for the S&P 500 Index is bearish with a descending trendline.
Market Sentiment Analysis
Equity futures are suggesting a bearish open as markets remain uncertain about President Trump’s Iran war strategy, as he calls for assistance, while also stating that he will focus on Cuba next. Volatility should remain elevated, and oil prices are moving higher, with Brent above $100. The Fed is expected to keep interest rates on hold this week, but the Reserve Bank of Australia hiked interest rates amid inflationary pressures. Earnings from Tencent, DocuSign, and Oklo are also on deck today.
Medtronic Fundamental Analysis
Medtronic is a medical device company that develops and manufactures innovative technologies and therapies. Its core segments are cardiovascular, medical surgical, neuroscience, and diabetes. It operates in over 150 countries and employs more than 90,000 people.
So, why am I bullish on MDT following its 17%+ sell-off?
I turned bullish on Medtronic after its Pulsed Field Ablation (PFA) portfolio delivered 70%+ organic growth and its Hugo robotic-assisted surgery (RAS) system received FDA clearance. Adding to bullish catalysts is the planned IPO of its diabetes unit, MiniMed Group (MMED). Strategic acquisitions such as CathWorks and Anteris, and regulatory approval for Stealth AXiS, confirm a healthy, revenue-positive pipeline and add to my bullish stance. MDT also raised its full-year guidance after beating earnings.
Metric | Value | Verdict |
P/E Ratio | 24.65 | Bearish |
P/B Ratio | 2.31 | Bearish |
PEG Ratio | 1.55 | Bullish |
Current Ratio | 2.54 | Bullish |
ROIC-WACC Ratio | Positive | Bullish |
Medtronic Fundamental Analysis Snapshot
The price-to-earnings (P/E) ratio of 24.65 indicates MDT is fairly valued. By comparison, the P/E ratio for the S&P 500 Index is 26.59.
The average analyst price target for MDT is $111.38. It suggests excellent upside potential with fading downside risks.
Medtronic Technical Analysis
Today’s MDT Signal
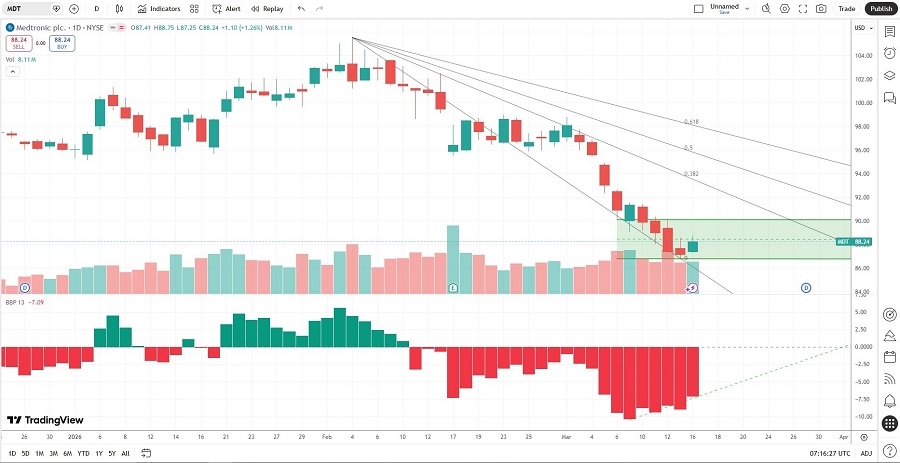
Medtronic Price Chart
The MDT D1 chart shows price action inside a horizontal support zone.
It also shows price action trading between its descending 0.0% and 38.2% Fibonacci Retracement Fan.
The Bull Bear Power Indicator is bearish with a positive divergence.
The average bearish trading volumes are higher than the average bullish trading volumes, hinting at more short-term volatility.
MDT corrected steeper than the S&P 500 Index, a bearish development, but bullish catalysts are rising.
My MDT Long Stock Trade
MDT Entry Level: Between $86.72 and $90.17
MDT Take Profit: Between $111.38 and $114.72
MDT Stop Loss: Between $75.96 and $79.29
Risk/Reward Ratio: 2.29
Ready to trade our analysis of Medtronic? Here is our list of the best stock brokers worth reviewing.