
Short Trade Idea
Enter your short position between $151.84 (an intermediate horizontal support level) and $160.27 (Friday’s close).
Market Index Analysis
Morgan Stanley (MS) is a member of the S&P 100 Index and the S&P 500 Index.
Both indices trade inside bearish price channels with rising bearish trading volumes.
The Bull Bear Power Indicator of the S&P 500 Index is bearish with a descending trendline.
Market Sentiment Analysis
Equity futures point to another bearish start to the trading session, building on last week’s massive sell-off, as the US-led war against Iran entered its second week. Oil futures spiked to nearly $120 per barrel as the quasi-closure of the Strait of Hormuz forced major oil producers to slash production. Should oil prices remain elevated for a prolonged period, it could tip the global economy into a recession, spike inflation, and raise borrowing costs. On the economic front, markets eagerly await Wednesday’s CPI and Friday’s PCI reports. Hewlett-Packard Enterprise, Oracle, Adobe, and Dick’s Sporting Goods highlight the earnings calendar.
Morgan Stanley Fundamental Analysis
Morgan Stanley is an investment bank and financial services company with offices in 42 countries and over 80,000 employees. Its three business segments are Institutional Securities, Wealth Management, and Investment Management.
So, why am I bearish on MS following its 16%+ correction?
I am bearish on Morgan Stanley and expect the current correction to extend, driven by its ongoing decline in wealth management net interest income (NII) and Common Equity Tier 1 (CET1) capital ratio. The recent correction came despite solid earnings, suggesting the good news is priced in already, and worries over its future performance dominate. Geopolitical risks, as highlighted by MS, add to downside pressure.
Metric | Value | Verdict |
P/E Ratio | 15.70 | Bearish |
P/B Ratio | 2.50 | Bearish |
PEG Ratio | 1.83 | Bullish |
Current Ratio | 2.05 | Bullish |
ROIC-WACC Ratio | Negative | Bearish |
Morgan Stanley Fundamental Analysis Snapshot
The price-to-earning (P/E) ratio of 15.70 makes MS a fairly valued bank stock. By comparison, the P/E ratio for the S&P 500 Index is 26.63.
The average analyst price target for MS is $195.52. This suggests there is excellent upside potential, but downside risks are greater.
Morgan Stanley Technical Analysis
Today’s MS Signal
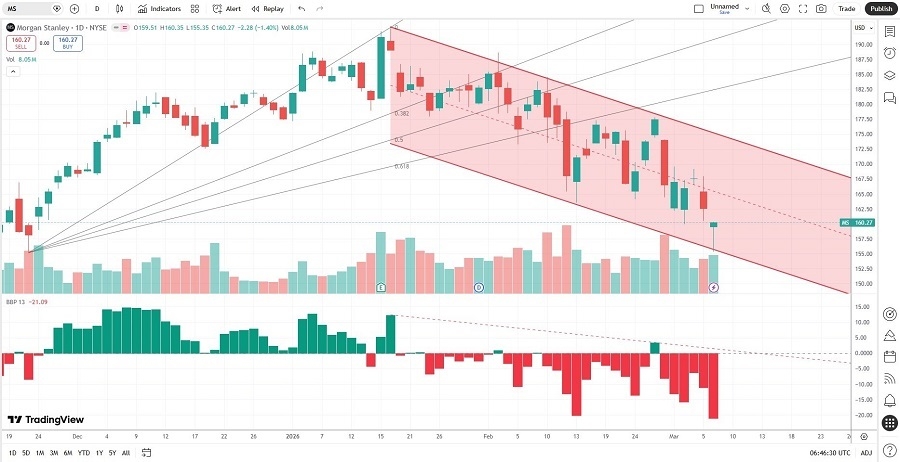
Morgan Stanley Price Chart
The MS D1 chart shows price action inside a bearish price channel.
It also shows price action below its ascending Fibonacci Retracement Fan.
The Bull Bear Power Indicator is bearish with a descending trendline.
The average bearish trading volumes are higher than the average bullish trading volumes.
MS corrected more than the S&P 500 Index did, which is a significant bearish trading confirmation.
My MS Short Stock Trade
MS Entry Level: Between $151.84 and $160.27
MS Take Profit: Between $123.88 and $128.81
MS Stop Loss: Between $165.41 and $169.60
Risk/Reward Ratio: 2.00
Ready to trade our analysis of Morgan Stanley? Here is our list of the best stock brokers worth checking out.