
Long Trade Idea
Enter your long position between $92.79 (the intra-day low of its last bullish candlestick) and $95.49 (yesterday’s intra-day high).
Market Index Analysis
Paychex (NASDAQ:PAYX) is a member of the NASDAQ 100 Index and the S&P 500 Index.
Both indices are trending lower inside bearish price channels with heightened downside risks.
The Bull Bear Power Indicator for the S&P 500 Index is bearish with a descending trendline.
Market Sentiment Analysis
Equity futures point to a bearish open amid conflicting reports over a truce between the US and Iran. Still, equity markets are on track to break a four-week bearish streak, barring a significant sell-off at the end of this week. Iran is drafting a law to introduce tolls for passage of the Strait of Hormuz. US recession risks have spiked amid the impact of high oil prices on consumers. Google’s TurboQuant technology breakthrough claims to limit memory usage, sending memory and disk makers tumbling.
Paychex Fundamental Analysis
Paychex is a human resources, payroll, and employee benefits company focused on small- to medium-sized businesses. It has over 100 offices and serves over 740,000 clients across the US and Europe.
So, why am I bullish on PAYX following its earnings beat?
Third-quarter revenue clocked in at $1.81 billion with earnings per share of $1.71, beating estimates of $1.78 billion and $1.67, respectively. I remain bullish on PAYX due to management’s upward revision for full-year 2026 guidance despite a challenging labor market. I am equally bullish on its 2025 Paycor acquisition, which started to contribute positively to revenues and earnings. Its AI integration within the Paychex Flex platform adds another tailwind.
Metric | Value | Verdict |
P/E Ratio | 20.61 | Bullish |
P/B Ratio | 8.56 | Bearish |
PEG Ratio | 1.76 | Bullish |
Current Ratio | 1.26 | Bearish |
ROIC-WACC Ratio | Positive | Bullish |
Paychex Fundamental Analysis Snapshot
The price-to-earnings (P/E) ratio of 20.61 makes PAYX an inexpensive stock. By comparison, the P/E ratio for the S&P 500 Index is 26.12.
The average analyst price target for PAYX is $110.93. This suggests moderate upside potential with reasonable downside risks.
Paychex Technical Analysis
Today’s PAYX Signal
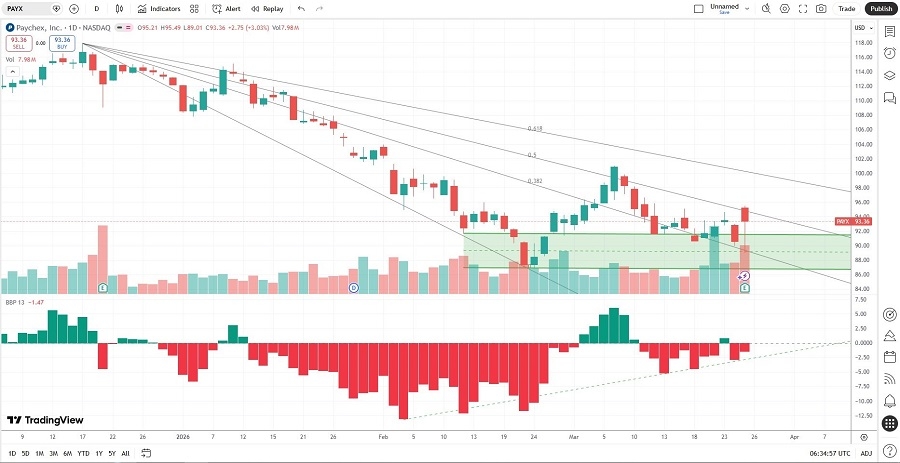
Paychex Price Chart
The PAYX D1 chart shows price action breaking out above its horizontal support zone.
It also shows price action between its descending 38.2% and 50.0% Fibonacci Retracement Fan levels.
The Bull Bear Power Indicator is bearish with an ascending trendline.
The average bullish trading volumes are higher than the average bearish trading volumes.
PAYX has outperformed the S&P 500 Index, a bullish trading confirmation.
My PAYX Long Stock Trade
PAYX Entry Level: Between $92.79 and $95.49
PAYX Take Profit: Between $115.07 and $117.83
PAYX Stop Loss: Between $82.85 and $85.30
Risk/Reward Ratio: 2.24
Ready to trade our analysis of Paychex? Here is our list of the best stock brokers worth checking out.