
Short Trade Idea
Enter your short position between $199.09 (Friday’s intra-day low) and $201.99 (an intermediate horizontal resistance level).
Market Index Analysis
Quest Diagnostics (DGX) is a member of the S&P 500 Index.
This index descends inside a bearish price channel with rising bearish trading volumes.
The Bull Bear Power Indicator for the S&P 500 Index is bearish with a descending trendline.
Market Sentiment Analysis
Equity futures are, but volatility could reverse early gains after equity markets reached 2026 lows, and oil prices remain elevated, trading near $100 per barrel. The US attacked Kharg Island, Iran’s economic crown jewel that accounts for over 90% of its oil-related activities, while President Trump may delay his trip to China, as he hopes to pressure China into helping with securing the Strait of Hormuz. Investors also eagerly await NVIDIA’s annual GTC conference, while the Fed will hold its second policy meeting of 2026.
Quest Diagnostics Fundamental Analysis
Quest Diagnostics is a clinical laboratory that offers diagnostic testing services for cancer, cardiovascular disease, infectious disease, neurological disorders, COVID-19, and employment and court-ordered drug testing.
So, why am I bearish on DGX following its breakdown?
I turned bearish on Quest Diagnostics amid its high debt load, which is weighing on its balance sheet. DGX also faces rising competition from integrated healthcare providers and AI-driven health tech firms, as well as declining pricing power and market share. I am equally bearish on reimbursement costs from Medicare, Medicaid, and private insurers. The regulatory landscape is shifting due to data privacy, AI-driven diagnostics, and gender dysphoria care protocols, which may also increase compliance costs. The reliance on government and exchange-based companies adds to my bearish outlook.
Metric | Value | Verdict |
P/E Ratio | 22.82 | Bullish |
P/B Ratio | 3.06 | Bearish |
PEG Ratio | 1.61 | Bullish |
Current Ratio | 1.04 | Bearish |
ROIC-WACC Ratio | Positive | Bullish |
Quest Diagnostics Fundamental Analysis Snapshot
The price-to-earning (P/E) ratio of 22.82 makes DGX an inexpensive stock. By comparison, the P/E ratio for the S&P 500 Index is 26.59.
The average analyst price target for DGX is $218.50. This suggests limited upside potential with expanding downside risks.
Quest Diagnostics Technical Analysis
Today’s DGX Signal
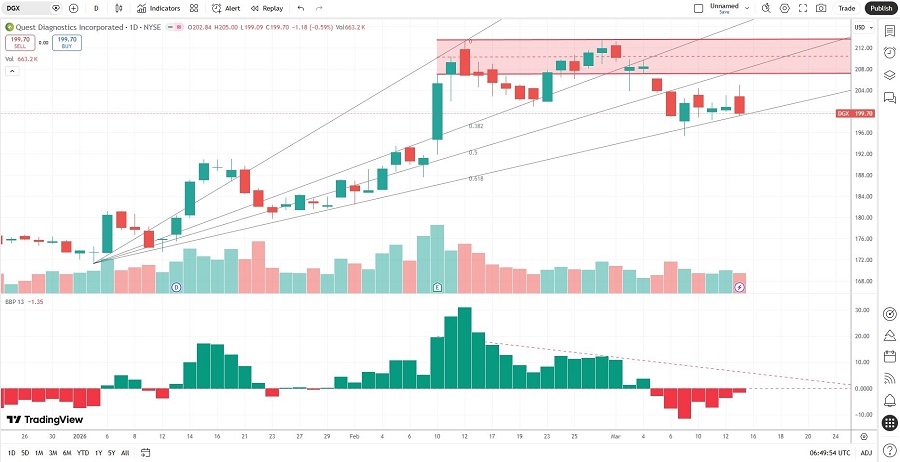
Quest Diagnostics Price Chart
The DGX D1 chart shows price action breaking down below its horizontal resistance zone.
It also shows price action trading between its ascending 50.0% and 61.8% Fibonacci Retracement Fan.
The Bull Bear Power Indicator is bearish with a descending trendline.
The average bearish trading volumes are higher than the average bullish trading volumes.
DGX corrected less than the S&P 500 Index, a bullish signal, but downside momentum is accelerating.
My DGX Short Stock Trade
DGX Entry Level: Between $199.09 and $201.99
DGX Take Profit: Between $157.20 and $163.00
DGX Stop Loss: Between $218.50 and $222.87
Risk/Reward Ratio: 2.16
Ready to trade our analysis of Quest Diagnostics? Here is our list of the best stock brokers worth checking out.