
Long Trade Idea
Enter your long position between €5.71 (the mid-range of its horizontal support zone) and €6.03 (yesterday’s intra-day high).
Market Index Analysis
Stellantis (Euronext MIL:STLAM) is a member of the FTSE MIB Index.
This index broke out above its horizontal support zone on low bullish trading volumes.
The Bull Bear Power Indicator for the FTSE MIB Index is bearish with an ascending trendline.
Market Sentiment Analysis
Equity futures point to a bearish open amid conflicting reports over a truce between the US and Israel. Still, equity markets are on track to break a four-week bearish streak, barring a significant sell-off at the end of this week. Iran is drafting a law to introduce tolls for passage of the Strait of Hormuz. US recession risks have spiked amid the impact of high oil prices on consumers. Google’s TurboQuant technology breakthrough claims to limit memory usage, sending memory and disk makers tumbling.
Stellantis Fundamental Analysis
Stellantis is a multinational automotive manufacturer with operations in 30 countries. It designs, manufactures, and markets Abarth, Alfa Romeo, Chrysler, Citroën, Dodge, DS Automobiles, Fiat, Jeep, Lancia, Maserati, Opel, Peugeot, Ram Trucks, and Vauxhall. It also owns a 20% stake in Chinese EV manufacturer Leapmotor.
So, why am I bullish on STLAM.MI despite its near-four-month 50% plunge?
I turned bullish on Stellantis amid its thriving North American business driven by demand for HEMI V8-powered trucks. The strategic pivot to customer demand led to a freedom-of-choice business model rather than its previous EV push, improving profitability and abandoning unprofitable programs. The improved product mix and quality have driven market share, and I see more gains ahead.
Metric | Value | Verdict |
P/E Ratio | 7.37 | Bullish |
P/B Ratio | 0.30 | Bullish |
PEG Ratio | 1.20 | Bullish |
Current Ratio | 1.02 | Bearish |
ROIC-WACC Ratio | Negative | Bearish |
Stellantis Fundamental Analysis Snapshot
The price-to-earning (P/E) ratio of 7.37 makes STLAM.MI an inexpensive stock. By comparison, the P/E ratio for the FTSE MIB Index is 13.13.
The average analyst price target for STLAM.MI is €8.12. This suggests excellent upside potential with acceptable downside risks.
Stellantis Technical Analysis
Today’s STLAM Signal
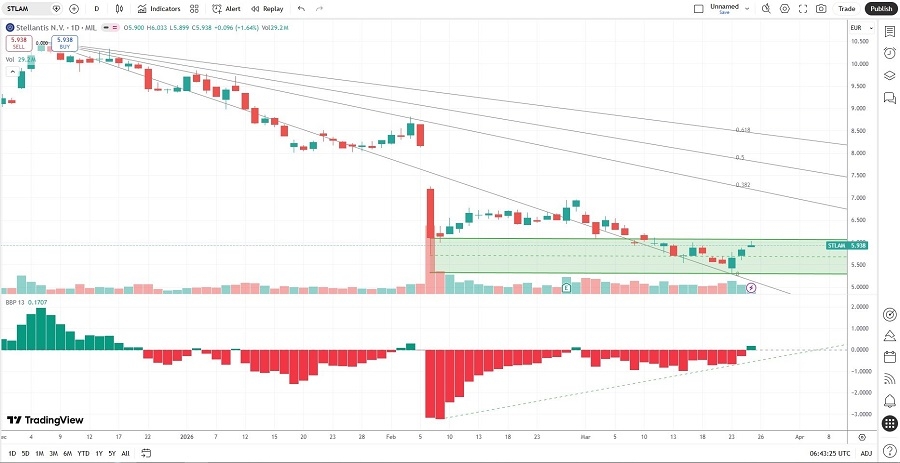
Stellantis Price Chart
The STLAM D1 chart shows price action inside a horizontal support zone.
It also shows price action between its descending 0.0% and 38.2% Fibonacci Retracement Fan levels.
The Bull Bear Power Indicator turned bullish with an ascending trendline.
The average bullish trading volumes are higher than the average bearish trading volumes.
STLAM corrected more steeply than the FTSE MIB Index, a bearish signal, but breakout catalysts are accumulating.
My STLAM Long Stock Trade
STLAM Entry Level: Between €5.71 and €6.03
STLAM Take Profit: Between €6.96 and €7.25
STLAM Stop Loss: Between €5.23 and €5.45
Risk/Reward Ratio: 2.60
Ready to trade our analysis of Stellantis? Here is our list of the best brokers in Italy worth checking out.