
The emergence of AI has driven demand for data center stocks, ushering in a new technological revolution.
What are Data Center Stocks?
Data center stocks refer to publicly listed companies that are actively involved in building and operating data centers. These companies are active in construction, power generation, thermal management, and data center operations. There are power-hungry, massive, warehouse-like buildings that house servers and related technology powering AI, the internet, and everything in the cloud.
Why Should You Consider Investing in Data Center Stocks?
Data centers are not a new investment phenomenon, as the internet requires them to operate. The breakthrough in AI adoption in 2022 created a demand boost, as hyperscalers require massive data centers for AI-related operations. The data center market is on track to exceed $600 billion by the end of 2030, as part of the multi-trillion AI sector, with annualized double-digit growth rates.
Here are a few things to consider when evaluating data center stocks:
Research data center stocks with revenue growth over the past three years.
Diversify your data center portfolio with companies that construct data centers, provide thermal management, and server components.
Mix your data center stock portfolio with companies involved in electricity generation.
Analyze the balance sheet and avoid high-debt data center stocks.
Check the Power Utilization Effectiveness (PUE), a core indicator of how efficiently the data center operates, together with occupancy rates.
What are the Downsides of Data Center Stocks?
The data center segment is highly competitive and requires massive capital expenditures to ensure servers run with the most cutting-edge technology. Energy availability is another significant factor, with some hyperscalers preferring colocation rather than relying on the energy provider. The AI hype has spiked valuations, which is adding to downside risks. The AI boom will eventually slow down, technological breakthroughs could result in lower data center demand than currently planned, and rising electricity costs could threaten capital expenditure plans.
Here is a shortlist of data center stocks to consider:
TE Connectivity (TEL)
Motorola Solutions (MSI)
Lumentum Holdings (LITE)
Digital Realty Trust (DLR)
VanEck Semiconductor ETF (SMH)
An Update on My Previous Best Data Center Stocks to Buy Item
In our previous installment, I highlighted the upside potential of IREN and Navitas Semiconductor.
IREN (NASDAQ:IREN) - A long position in WULF between $33.34 and $37.25
IREN surged over 55%, and my stop-loss closed this trade at $47.00 for a profit just shy of 47%.
Navitas Semiconductor (NASDAQ:NVTS) - A long position in NVTS between $8.15 and $8.28
NVTS skyrocketed by more than 150%, and my stop-loss triggered, closing the trade at $17.80 for a profit exceeding 128%.
TE Connectivity (NYSE:TEL) Fundamental Analysis
TE Connectivity (NYSE:TEL) designs and manufactures electrical and electronic components for automotive, aerospace, defense, medical, and energy industries in approximately 140 countries. TEL employs over 89,000 people, including more than 8,000 engineers. It is also a member of the S&P 500 Index.
So, why am I bullish on TE Connectivity after its post-earnings slump?
Despite a minor revenue miss, TE Connectivity reported excellent earnings, with orders surging to a record $5.3 billion, and TEL returned nearly 100% of its free cash flow of $1.3 billion to shareholders. I am also bullish on its increased AI-guidance on the demand for high-speed copper and optical connectivity solutions. It also offers quality diversification via exposure to industrial and transportation sectors.
Metric | Value | Verdict |
P/E Ratio | 21.93 | Bullish |
P/B Ratio | 4.81 | Bearish |
PEG Ratio | 1.26 | Bullish |
Current Ratio | 1.89 | Bearish |
Return on Assets | 9.55% | Bullish |
Return on Equity | 22.72% | Bullish |
Profit Margin | 15.54% | Bullish |
ROIC-WACC Ratio | Negative | Bearish |
Dividend Yield | 2.91% | Bullish |
TE Connectivity Fundamental Analysis Snapshot
The price-to-earning (P/E) ratio of 21.93 makes TE Connectivity an inexpensive stock. By comparison, the P/E ratio for the S&P 500 Index is 25.65.
The average analyst price target for TE Connectivity is $265.00. This suggests good upside potential with manageable downside risks.
TE Connectivity Technical Analysis
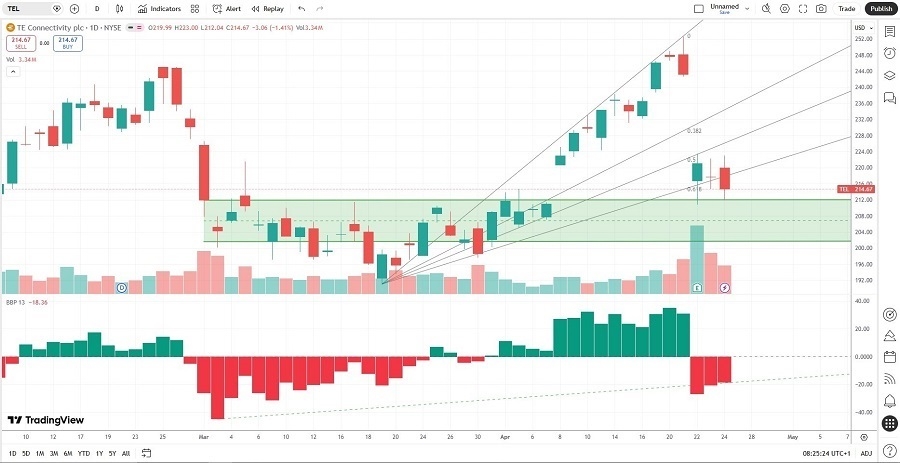
TE Connectivity Price Chart
The TE Connectivity D1 chart shows price action below its ascending Fibonacci Retracement Fan.
It also shows TE Connectivity just above its horizontal support zone.
The Bull Bear Power Indicator is bearish with an ascending trendline.
My TE Connectivity Long Stock Trade
TE Connectivity Entry Level: Between $212.04 and $217.73
TE Connectivity Take Profit: Between $252.56 and $257.61
TE Connectivity Stop Loss: Between $193.55 and $197.59
Risk/Reward Ratio: 2.19
Motorola Solutions (NYSE:MSI) Fundamental Analysis
Motorola Solutions (NYSE:MSI) provides safety and security products and services for critical communications, video security, and command center technologies primarily used by public safety agencies and enterprises. It is also a member of the S&P 500 Index.
So, why am I bullish on Motorola Solutions despite its recent sell-off?
Motorola Solutions continues to expand its AI portfolio, and I am bullish on its record backlog of $15.7 billion. It offers vital cloud security products, and its growing portfolio of Agentic AI solutions should drive shares higher, after exlisping 50% of total revenues. Its $4.4 billion acquisition of Silvus Technologies ($4.4B) added defense and unmanned system networking, and further diversified its revenue mix.
Metric | Value | Verdict |
P/E Ratio | 34.37 | Bearish |
P/B Ratio | 30.56 | Bearish |
PEG Ratio | 2.42 | Bullish |
Current Ratio | 1.04 | Bearish |
Return on Assets | 11.40% | Bullish |
Return on Equity | 104.20% | Bullish |
Profit Margin | 18.44% | Bullish |
ROIC-WACC Ratio | Positive | Bullish |
Dividend Yield | 4.84% | Bullish |
Motorola Solutions Fundamental Analysis Snapshot
The price-to-earning (P/E) ratio of 34.37 makes Motorola Solutions an expensive stock. By comparison, the P/E ratio for the S&P 500 Index is 25.65.
The average analyst price target for Motorola Solutions is $505.45. This suggests excellent upside potential with decreasing downside risks.
Motorola Solutions Technical Analysis
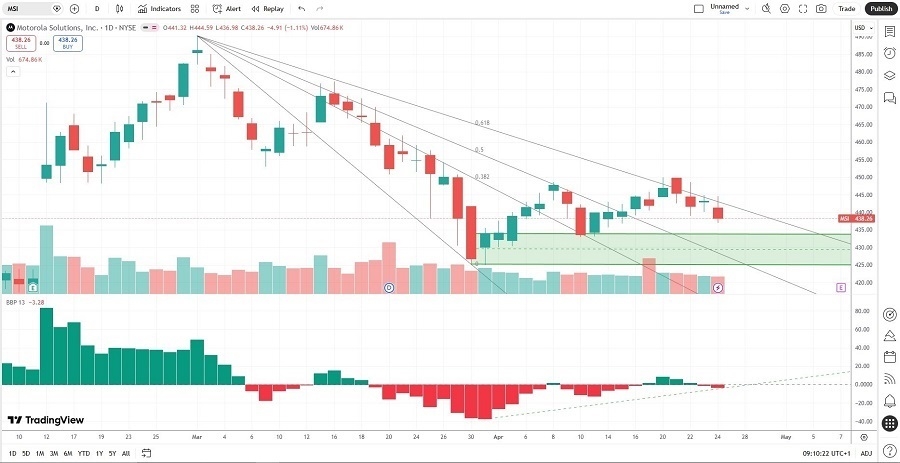
Motorola Solutions Price Chart
The Motorola Solutions D1 chart shows price action between its descending 50.0% and 61.8% Fibonacci Retracement Fan levels.
It also shows Motorola Solutions approaching a horizontal support zone.
The Bull Bear Power Indicator is bearish with an ascending trendline, nearing a bullish crossover.
My Motorola Solutions Long Stock Trade
NVTS Entry Level: Between $434.13 and $444.59
NVTS Take Profit: Between $481.62 and $490.24
NVTS Stop Loss: Between $412.24 and $417.22
Risk/Reward Ratio: 2.17
Ready to trade our analysis of the best data center stocks? Here is our list of the best stockbrokers worth reviewing.