
Short Trade Idea
Enter a short position between $191.52 (Friday’s intra-day low) and $194.71 (Friday’s intra-day high).
Market Index Analysis
Capital One (NYSE:COF) is a member of the S&P 100 Index and the S&P 500 Index.
Both indices continue to rebound from 2026 lows, but bullish trading volumes remain low and do not confirm the recovery.
The Bull Bear Power Indicator for the S&P 500 Index is bullish and spiked above its descending trendline.
Market Sentiment Analysis
Equity futures are tumbling this morning after peace talks between the US and Iran failed, and US President Trump moved from opening the Strait of Hormuz to blockading it. Oil prices spiked above $100 following the move. The first quarter earnings season could provide the next catalysts, with Goldman Sachs kicking off today. Bank of America, Wells Fargo , Citigroup, JPMorgan Chase, and Morgan Stanley will report throughout the week.
Capital One Fundamental Analysis
Capital One is a bank holding company, the third-largest issuer of Visa and Mastercard credit cards, and a leading US car finance company. It is also the ninth-largest US bank by total assets as of September 30, 2024.
So, why am I bearish on COF despite its recent breakout?
Despite its nearly 33% correction, valuations remain excessive, especially for a mature financial institution. I am bearish amid ongoing credit quality deterioration, as evidenced by Q4 2025 provisions for credit losses of nearly $4 billion. I am also bearish on Brex’s integration costs, which could further pressure profit margins, while scrutiny of overdraft fees, late charges, and interchange fees adds short-term uncertainty.
Metric | Value | Verdict |
P/E Ratio | 57.44 | Bearish |
P/B Ratio | 1.06 | Bullish |
PEG Ratio | 0.20 | Bullish |
Current Ratio | Unavailable | Bearish |
ROIC-WACC Ratio | Negative | Bearish |
Capital One Fundamental Analysis Snapshot
The price-to-earnings (P/E) ratio of 57.44 makes COF an expensive stock. By comparison, the P/E ratio for the S&P 500 Index is 24.55.
The average analyst price target for COF is $259.95. This suggests there is excellent upside potential with accelerating downside risks.
Capital One Technical Analysis
Today’s COF Signal
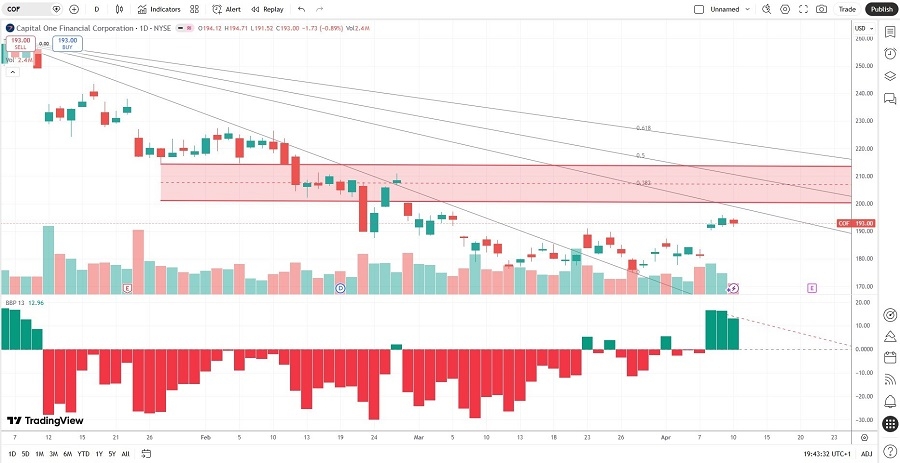
Capital One Price Chart
The COF D1 chart shows price action approaching a horizontal resistance zone.
It also shows price action between its descending 0.0% and 38.2% Fibonacci Retracement Fan levels.
The Bull Bear Power Indicator is bullish with a descending trendline.
The average bullish trading volumes are higher than the average bearish trading volumes, suggesting more short-term volatility.
COF followed the S&P 500 Index higher, a bullish confirmation, but bearish catalysts are accumulating.
My COF Short Stock Trade
COF Entry Level: Between $191.52 and $194.71
COF Take Profit: Between $143.22 and $149.69
COF Stop Loss: Between $211.00 and $214.57
Risk/Reward Ratio: 2.48
Ready to trade our analysis of Capital One? Here is our list of the best stock brokers worth reviewing.