
Short Trade Idea
Enter your short position between $176.88 (the intra-day low of its last bearish candlestick) and $185.12 (last week’s intra-day high).
Market Index Analysis
Equifax (NYSE:EFX) is a member of the S&P 500 Index.
This index is pushing higher from its 2026 lows, but bullish trading volumes remain low.
The Bull Bear Power Indicator for the S&P 500 Index turned bullish with an ascending trendline.
Market Sentiment Analysis
Equity futures are moving lower as oil extends its advance amid uncertainty about what US President Trump will do once his Tuesday deadline for Iran to reopen the Strait of Hormuz passes. He vowed to bomb Iran’s power plants and infrastructure today, as negotiations for a cease-fire and potential end to the war resume. President Trump backed away from seizing Iran’s oil amid domestic pressures to end the war. On the economic front, preliminary durable goods orders for February will be released this morning.
Equifax Fundamental Analysis
Equifax is a consumer credit reporting agency and is part of the Big Three, alongside Experian and TransUnion. It collects data on over 800 million consumers and 88 million businesses globally.
So, why am I bearish on EFX despite a potential breakout?
The expected 10% earnings decline amid weaker-than-expected mortgage activity and higher operating costs due to product innovation form the core of my bearish narrative. Macroeconomic challenges are weighing on revenue growth, and despite a 46% correction, valuations remain high. Shrinking operating margins and stagnant earnings per share are other red flags suggesting shares are overvalued. Analyst downgrades pose another risk, while Equifax still suffers the consequences from the 2017 data breach.
Metric | Value | Verdict |
P/E Ratio | 34.16 | Bearish |
P/B Ratio | 4.78 | Bearish |
PEG Ratio | 0.83 | Bullish |
Current Ratio | 0.61 | Bearish |
ROIC-WACC Ratio | Negative | Bearish |
Equifax Fundamental Analysis Snapshot
The price-to-earnings (P/E) ratio of 34.16 makes EFX an expensive stock. By comparison, the P/E ratio for the S&P 500 Index is 23.77.
The average analyst price target for EFX is $236.55. It suggests excellent upside potential, but downside risks remain elevated.
Equifax Technical Analysis
Today’s EFX Signal
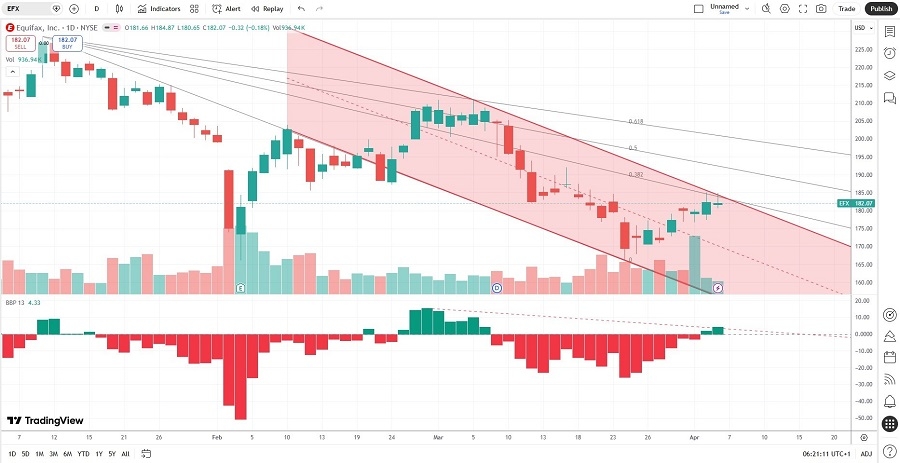
Equifax Price Chart
The EFX D1 chart shows price action inside a bearish price channel.
It also shows price action between its descending 0.0% and 38.2% Fibonacci Retracement Fan levels.
The Bull Bear Power Indicator is bullish but below its descending trendline.
The average bearish trading volumes are higher than the average bullish trading volumes, except for a one-day anomaly.
EFX moved higher with the S&P 500 Index, a bullish confirmation, but downside catalysts remain dominant.
My EFX Short Stock Trade
EFX Entry Level: Between $176.88 and $185.12
EFX Take Profit: Between $129.44 and $135.98
EFX Stop Loss: Between $198.97 and $205.25
Risk/Reward Ratio: 2.15
Ready to trade our analysis of Equifax? Here is our list of the best stock brokers worth checking out.