
Short Trade Idea
Enter your short position between $353.50 (Thursday’s intra-day low) and $364.56 (Thursday’s intra-day high).
Market Index Analysis
FedEx (NYSE:FDX) is a member of the S&P 100 Index and the S&P 500 Index.
Both indices correct within a bearish price channel with fading depressed bullish factors.
The Bull Bear Power Indicator for the S&P 500 Index turned bearish with a descending trendline.
Market Sentiment Analysis
Equity futures are moving lower as oil futures spike after US President Trump renewed his vow to destroy Iran unless they open the Strait of Hormuz by Tuesday. Markets await Thursday’s CPI and Friday’s PCE reports, which will offer clues on how the oil price surge has impacted inflationary pressures, but the true impact will take more time to work through the economy. Earnings from Delta, Levi Strauss, and Constellation Brands are also due this week, while a Trump administrator hinted at broad tariff refunds.
FedEx Fundamental Analysis
FedEx is a transportation, e-commerce, and business services conglomerate with over 210,00 motorized vehicles.
So, why am I bearish on FDX at current levels?
Medium-term risks arise from its ongoing corporate restructuring, including one-time costs and execution risks related to its spin-off of FedEx Freight. The Iran war has spiked fuel costs by over 50%, further magnifying my bearish near-term outlook, and the temporary grounding of its MD-11 fleet added $175 million in additional costs for Q3. Execution risks related to its Network 2.0 transformation and Tricolor initiatives could increase service disruptions amid ongoing macroeconomic weakness.
Metric | Value | Verdict |
P/E Ratio | 19.31 | Bearish |
P/B Ratio | 2.88 | Bearish |
PEG Ratio | 1.27 | Bullish |
Current Ratio | 1.47 | Bearish |
ROIC-WACC Ratio | Positive | Bullish |
FedEx Fundamental Analysis Snapshot
The price-to-earnings (P/E) ratio of 19.31 makes FDX an expensive stock in the transportation sector, but an inexpensive one in the S&P 500. By comparison, the P/E ratio for the S&P 500 Index is 23.70.
The average analyst price target for FDX is $402.57. It suggests moderate upside potential with heightened downside risks.
FedEx Technical Analysis
Today’s FDX Signal
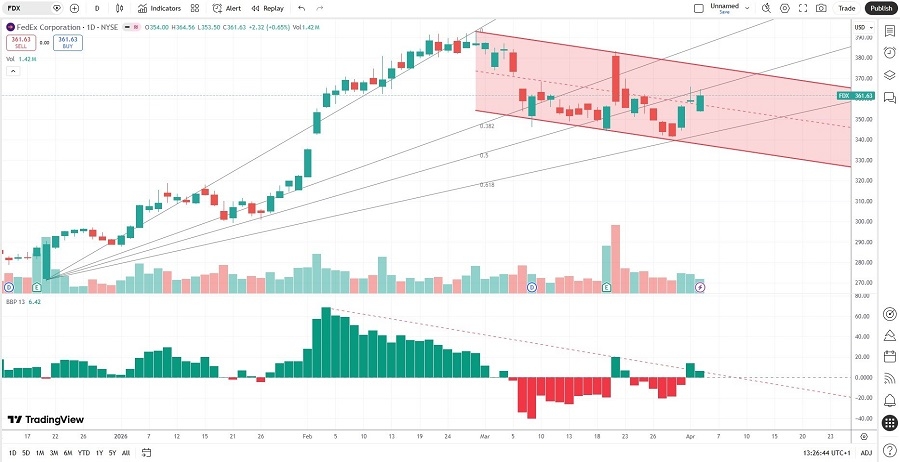
FedEx Price Chart
The FDX D1 chart shows price action inside a bearish price channel.
It also shows price action between its ascending 50.0% and 61.8% Fibonacci Retracement Fan levels.
The Bull Bear Power Indicator turned bullish but remains below its descending trendline.
The average bearish trading volumes are higher than the average bullish trading volumes.
FDX corrected with the S&P 500 Index moved lower, a bearish confirmation.
My FDX Short Stock Trade
FDX Entry Level: Between $353.50 and $364.56
FDX Take Profit: Between $270.80 and $278.70
FDX Stop Loss: Between $392.86 and $402.57
Risk/Reward Ratio: 2.10
Ready to trade our analysis of FedEx? Here is our list of the best stock brokers worth checking out.