
Top Regulated Brokers
Short Trade Idea
Enter your short position between $335.45 (the intra-day low of its last bullish candlestick) and $348.20 (the upper band of its horizontal resistance zone).
Market Index Analysis
American Express (NYSE:AXP) is a member of the Dow Jones Industrial Average Index, the S&P 100 Index, and the S&P 500 Index.
All three indices trade near all-time highs within bearish chart patterns.
The Bull Bear Power Indicator for the S&P 500 Index is bullish with a descending trendline.
Market Sentiment Analysis
Equity futures are lower this morning as markets digest progress in US-Iran peace negotiations, in which both sides agreed to a 60-day window to finalize talks. Oil prices are likely to remain elevated, and all eyes are on Thursday’s Personal Consumption Expenditures price index, the Federal Reserve’s preferred inflation gauge, especially following last week’s more hawkish tone.
American Express Fundamental Analysis
American Express is the world’s fourth-largest card network based on purchase volume. It generally caters to more affluent consumers and is well known for its rewards, exclusive offers, and partnership programs.
So, why am I bearish on AXP despite its recent rally?
American Express struggles in its commercial segment amid fierce competition, especially from the FinTech sector, and its share price does not reflect these bearish catalysts. AI disruption is another underpriced threat to AXP’s business model, while macroeconomic issues in the white-collar segment limit upside revenue potential. Regulatory risks could spark risk-weighted asset (RWA) inflation, while analysts began revising price targets downward.
Metric | Value | Verdict |
P/E Ratio | 21.10 | Bearish |
P/B Ratio | 6.78 | Bearish |
PEG Ratio | 1.61 | Bearish |
Current Ratio | 1.57 | Bearish |
ROIC-WACC Ratio | Negative | Bearish |
American Express Fundamental Analysis Snapshot
The price-to-earnings (P/E) ratio of 21.10 makes AXP an expensive stock in its industry. By comparison, the P/E ratio for the S&P 500 Index is 32.23.
The average analyst price target for AXP is $363.11. This suggests moderate upside potential with rising downside risks.
American Express Technical Analysis
Today’s AXP Signal
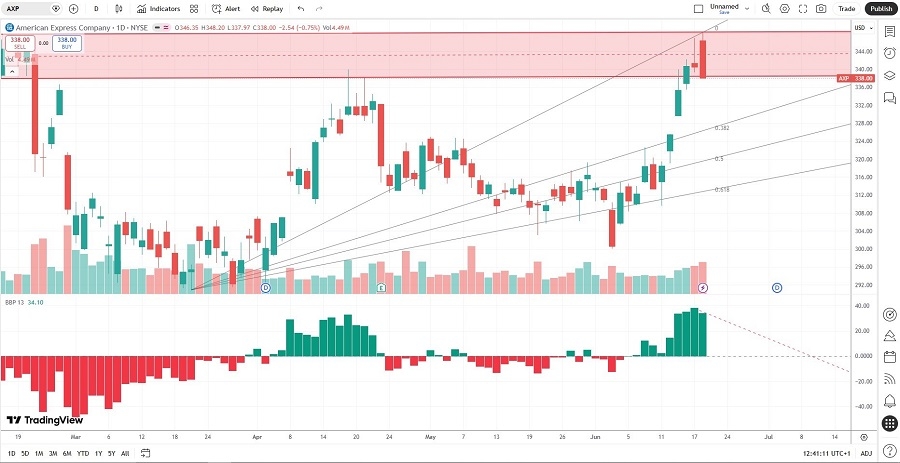
American Express Price Chart
The AXP D1 chart shows price action breaking down below its horizontal support zone.
It also shows price action between its ascending 0.0% and 38.2% Fibonacci Retracement Fan levels.
The Bull Bear Power Indicator turned bullish with a descending trendline.
The average bearish trading volumes are higher than the average bullish trading volumes.
AXP has recently outperformed the S&P 500 Index, a bullish signal, but breakdown pressures are rising.
My AXP Short Stock Trade
AXP Entry Level: Between $335.45 and $348.20
AXP Take Profit: Between $286.15 and $292.58
AXP Stop Loss: Between $359.06 and $369.50
Risk/Reward Ratio: 2.09
Ready to trade our analysis of American Express? Here is our list of the best stockbrokers worth checking out.