
Short Trade Idea
Enter your short position between $168.63 (yesterday’s intra-day low) and $174.44 (yesterday’s intra-day high).
Market Index Analysis
Coinbase (NASDAQ:COIN) is a member of the S&P 500 Index.
This index trades near its all-time high, but bullish trading volumes are decreasing and do not confirm the current three-day rally.
The Bull Bear Power Indicator for the S&P 500 Index turned bullish but remains below its descending trendline.
Market Sentiment Analysis
Equity futures hold value with no momentum this morning as markets look for the next catalysts and as the US Federal Reserve starts its meeting under new Chair Warsh. Most investors zero in on interest rates, but the massive balance sheet remains largely ignored, which could affect market liquidity and cause more issues than interest rates do. Oil prices hover near $80, and despite renewed hopes for a lasting US-Iran peace deal, concerns about a global slowdown persist.
Top Regulated Brokers
Coinbase Fundamental Analysis
Coinbase is the world’s biggest Bitcoin custodian and the largest US-based cryptocurrency exchange with over 100 million users. It operates in over 100 countries and holds over $400 billion in assets, including over 12% of Bitcoin and over 11% of all staked Ether.
So, why am I bearish on COIN despite its current correction?
Despite a 33%+ correction, valuations remain high, and I remain bearish due to declining trading volumes, which could drop by 20% in the current quarter, with April and May the slowest trading months in years. Rising competition, especially in tokenized pre-IPO trading, with SpaceX (NASDAQ:SPCX) the most recent example, continues to drive trading volumes away from Coinbase, prompting analyst downgrades.
Metric | Value | Verdict |
P/E Ratio | 62.59 | Bearish |
P/B Ratio | 3.32 | Bearish |
PEG Ratio | 0.94 | Bullish |
Current Ratio | 2.14 | Bullish |
ROIC-WACC Ratio | Negative | Bearish |
Coinbase Fundamental Analysis Snapshot
The price-to-earning (P/E) ratio of 62.59 makes COIN an expensive stock. By comparison, the P/E ratio for the S&P 500 Index is 32.59.
The average analyst price target for COIN is $229.74. This suggests that there is excellent upside potential, but downside risks are greater.
Coinbase Technical Analysis
Today’s COIN Signal
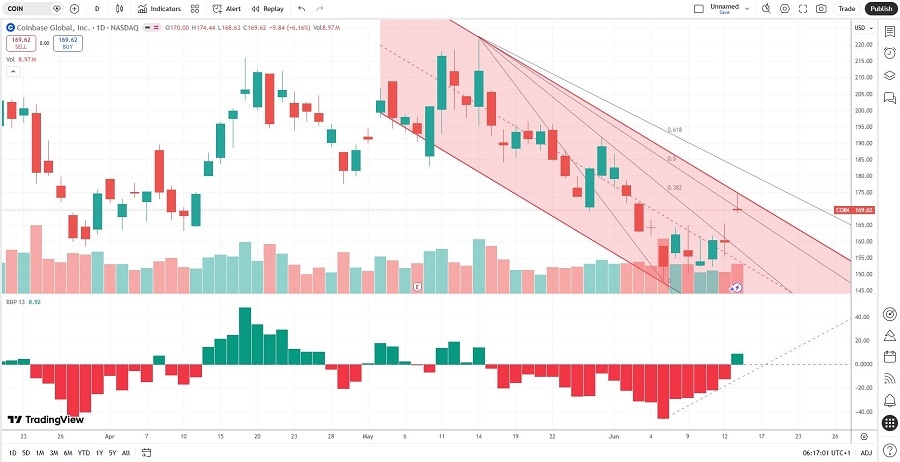
Coinbase Price Chart
The COIN D1 chart shows price action inside a bearish price channel.
It also shows price action between its descending 50.0% and 61.8% Fibonacci Retracement Fan levels.
The Bull Bear Power Indicator turned bullish with an ascending trendline.
The average bearish trading volumes are higher than the average bullish trading volumes.
COIN corrected more than the S&P 500 Index, a notable bearish development.
My COIN Short Stock Trade
COIN Entry Level: Between $168.63 and $174.44
COIN Take Profit: Between $120.90 and $125.81
COIN Stop Loss: Between $191.83 and $197.85
Risk/Reward Ratio: 2.06
Ready to trade our analysis of Coinbase? Here is our list of the best stock brokers worth checking out.