
Short Trade Idea
Enter your short position between $231.62 (an intermediate horizontal support level) and $240.70 (yesterday’s intra-day high).
Market Index Analysis
Garmin (NYSE:GRMN) is a member of the S&P 500 Index.
This index trades inside a bearish chart pattern near its all-time high, alongside rising breakdown catalysts.
The Bull Bear Power Indicator for the S&P 500 Index is bullish but remains below its descending trendline.
Top Regulated Brokers
Market Sentiment Analysis
Equity futures are drifting higher this morning after a tech-led sell-off drove the S&P 500 Index and the NASDAQ Index lower, while Oil trades below $80 per barrel as the US and Iran agreed to a 14-point peace proposal. Markets await today’s Federal Reserve decision, with interest rates likely to remain on hold, but changes to the Fed under Warsh could emerge, and he will get his first chance to communicate his view on future monetary policy.
Garmin Fundamental Analysis
Garmin is a tech company known for its GPS, navigation, communication, and sensor-based products catering to the automotive, aviation, marine, and recreational markets. It employs nearly 23,000 employees in 34 countries.
So, why am I bearish on GRMN as its shares trend sideways?
Garmin struggles with deteriorating inventory efficiency, as Days Inventory surged to 232.39 days, 38% above its 10-year median of 167.85 days, and well above the industry median of 92.76 days. It poses profitability risks, especially if Garmin starts discounting inventory to clear it for new products. The phased discontinuation of its BMW program adds a notable near-term revenue cliff, while insider selling amid elevated valuations adds to downside catalysts, which are further magnified by continued analyst downgrades.
Metric | Value | Verdict |
P/E Ratio | 26.25 | Bullish |
P/B Ratio | 4.95 | Bearish |
PEG Ratio | 3.27 | Bearish |
Current Ratio | 4.36 | Bullish |
ROIC-WACC Ratio | Positive | Bullish |
Garmin Fundamental Analysis Snapshot
The price-to-earnings (P/E) ratio of 26.25 makes GRMN an inexpensive stock. By comparison, the P/E ratio for the S&P 500 Index is 32.39.
The average analyst price target for GRMN is $262.43. This suggests moderate upside potential, but downside risks remain dominant.
Garmin Technical Analysis
Today’s GRMN Signal
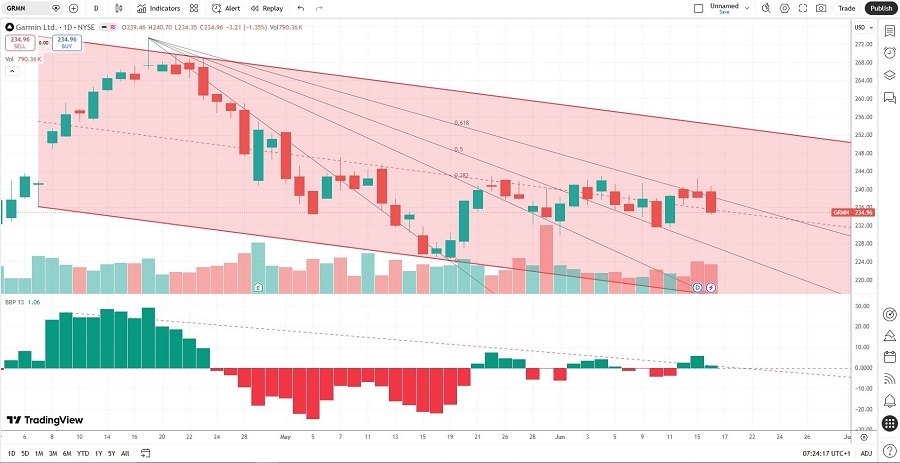
Garmin Price Chart
The GRMN D1 chart shows price action inside a bearish price channel.
It also shows price action between its descending 50.0% and 61.8% Fibonacci Retracement Fan levels.
The Bull Bear Power Indicator is bullish, with a descending trendline, nearing a bearish crossover.
The average bearish trading volumes are higher than the average bullish trading volumes.
GRMN trended sideways as the S&P 500 Index advanced, a bearish confirmation.
My GRMN Short Stock Trade
GRMN Entry Level: Between $231.62 and $240.70
GRMN Take Profit: Between $181.92 and $192.90
GRMN Stop Loss: Between $254.98 and $262.43
Risk/Reward Ratio: 2.13
Ready to trade our analysis of Garmin? Here is our list of the best stockbrokers worth reviewing.