
Short Trade Idea
Enter your short position between $225.64 (the intra-day low of its breakdown) and $229.59 (yesterday’s intra-day high).
Market Index Analysis
M&T Bank (NYSE:MTB) is a member of the S&P 500 Index.
This index trades inside a bearish chart pattern near its all-time high, alongside rising breakdown catalysts.
The Bull Bear Power Indicator for the S&P 500 Index is bullish but remains below its descending trendline.
Top Regulated Brokers
Market Sentiment Analysis
Equity futures are drifting higher this morning after a tech-led sell-off drove the S&P 500 Index and the NASDAQ Index lower, while Oil trades below $80 per barrel as the US and Iran agreed to a 14-point peace proposal. Markets await today’s Federal Reserve decision, with interest rates likely to remain on hold, but changes to the Fed under Warsh could emerge, and he will get his first chance to communicate his view on future monetary policy.
M&T Bank Fundamental Analysis
M&T Bank is a regional bank holding company founded in 1856 with over 950 branches spanning twelve states.
So, why am I bearish on MTB despite its current rally?
While valuations are attractive, reports of insider selling in late May and early June by high-level executives have added to my bearish sentiment. I am also bearish on ongoing uncertainty over its commercial real estate portfolio, especially its exposure to the office sector. Despite management’s positive comments, including the doubling of loan growth, the increase derives from a low base, and M&T Bank may experience below-peer loan growth. MTB also trades near the average analyst price target and risks downward earnings revisions.
Metric | Value | Verdict |
P/E Ratio | 12.82 | Bullish |
P/B Ratio | 1.30 | Bullish |
PEG Ratio | 1.42 | Bullish |
Current Ratio | Unavailable | Bearish |
ROIC-WACC Ratio | Negative | Bearish |
M&T Bank Fundamental Analysis Snapshot
The price-to-earnings (P/E) ratio of 12.82 makes MTB an inexpensive stock. By comparison, the P/E ratio for the S&P 500 Index is 32.39.
The average analyst price target for MTB is $233.33. This suggests negligible upside potential with elevated downside risks.
M&T Bank Technical Analysis
Today’s MTB Signal
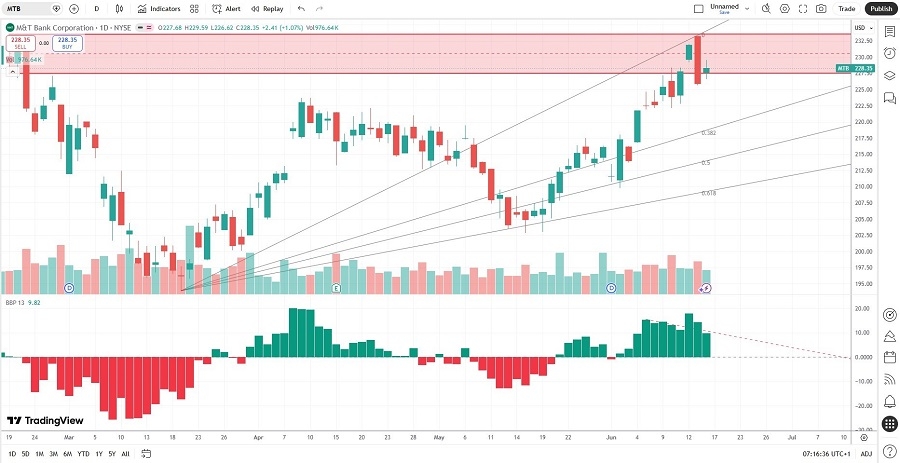
M&T Bank Price Chart
The MTB D1 chart shows price action inside its horizontal resistance zone.
It also shows price action between its ascending 0.0% and 38.2% Fibonacci Retracement Fan levels.
The Bull Bear Power Indicator turned bullish with a negative divergence.
The average bearish trading volumes are higher than the average bullish trading volumes.
MTB outperformed the S&P 500 Index over the past few weeks, a bullish confirmation, but bearish catalysts are accumulating.
My MTB Short Stock Trade
MTB Entry Level: Between $225.64 and $229.59
MTB Take Profit: Between $209.74 and $213.68
MTB Stop Loss: Between $233.33 and $239.00
Risk/Reward Ratio: 2.07
Ready to trade our analysis of MT Bank? Here is our list of the best stockbrokers worth reviewing.