
Top Regulated Brokers
Short Trade Idea
Enter your short position between $46.02 (the lower band of its horizontal resistance zone) and $48.67 (the upper band of its horizontal resistance zone).
Market Index Analysis
Southwest Airlines (NYSE:LUV) is a member of the S&P 500 Index.
This index trades near all-time highs within a bearish chart pattern.
The Bull Bear Power Indicator for the S&P 500 Index is bullish with a descending trendline.
Market Sentiment Analysis
Equity futures are lower this morning as markets digest progress in US-Iran peace negotiations, in which both sides agreed to a 60-day window to finalize talks. Oil prices are likely to remain elevated, and all eyes are on Thursday’s Personal Consumption Expenditures price index, the Federal Reserve’s preferred inflation gauge, especially following last week’s more hawkish tone.
Southwest Airlines Fundamental Analysis
Southwest Airlines is the fourth-largest US-based airline, serving over 100 destinations across 42 states and ten countries in the Gulf of Mexico and the Caribbean. It operates an all Boeing-737 fleet of over 810 aircraft. It also has over 500 Boeing-737 MAX on order.
So, why am I bearish on LUV at current levels?
While oil prices have decreased from their 2026 peak, they have caused significant damage across the economy and are likely to remain elevated. Southwest Airlines’ management noted that each $0.01 in fuel prices adds $22 million in operating costs, and it ended its fuel hedge program last year, resulting in underappreciated profitability concerns. Uncertainty concerning yet another labor union negotiation adds to my bearishness.
Metric | Value | Verdict |
P/E Ratio | 31.98 | Bearish |
P/B Ratio | 3.41 | Bearish |
PEG Ratio | 0.33 | Bullish |
Current Ratio | 0.48 | Bearish |
ROIC-WACC Ratio | Negative | Bearish |
Southwest Airlines Fundamental Analysis Snapshot
The price-to-earning (P/E) ratio of 31.98 makes LUV an expensive stock. By comparison, the P/E ratio for the S&P 500 Index is 32.23.
The average analyst price target for LUV is $45.95. This suggests no upside potential with accumulating downside risks.
Southwest Airlines Technical Analysis
Today’s LUV Signal
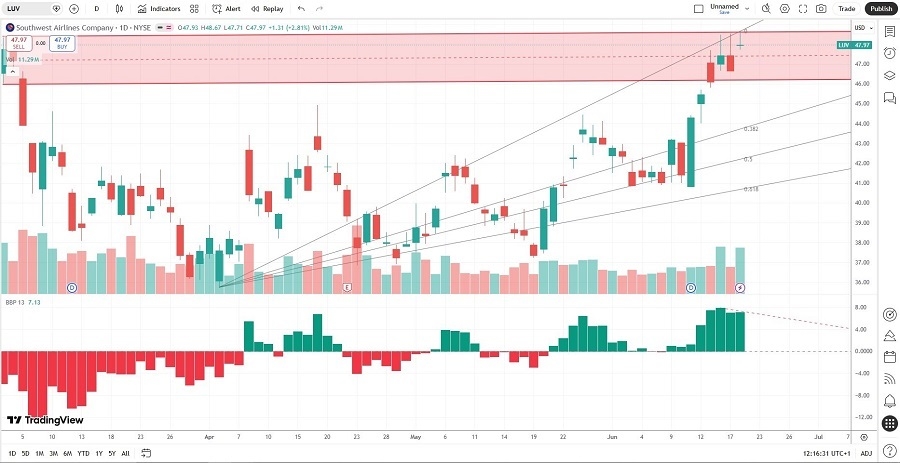
Southwest Airlines Price Chart
The LUV D1 chart shows price action inside a horizontal resistance zone.
It also shows price action between its ascending 0.0% and 38.2% Fibonacci Retracement Fan levels.
The Bull Bear Power Indicator is bullish with a negative divergence.
The average bullish trading volumes are higher than the average bearish trading volumes, hinting at more short-term volatility potential.
LUV outperformed the S&P 500 Index over the past week, a bullish sign, but bearish catalysts are rising.
My LUV Short Stock Trade
LUV Entry Level: Between $46.02 and $48.67
LUV Take Profit: Between $31.15 and $33.80
LUV Stop Loss: Between $52.97 and $55.11
Risk/Reward Ratio: 2.14
Ready to trade our analysis of Southwest Airlines? Here is our list of the best stockbrokers worth checking out.