


Apple (NASDAQ:AAPL) has repeatedly leaned on China's “618” shopping festival to reignite iPhone demand in an increasingly competitive market. Did this year’s aggressive discounting fail to do the job?
Apple offered discounts of up to CNY 2,000 on the iPhone 17 Pro series, yet iPhone sales in China still fell 9% year over year during the four-week promotional period. Is heavier price-cutting no longer enough to move units in Apple’s most important growth market anymore?
Top Regulated Brokers
Why a Weak 618 Matters for Apple’s China Story
Apple began its promotional push roughly a month before June 18th, combining official discounts, platform subsidies, and trade-in incentives. The campaign lifted Apple to the number two spot in China’s smartphone market with an 18% share. Still, sales declined at a slower rate than most Chinese rivals, but they declined nonetheless, according to Counterpoint Research. Huawei was the only major brand to grow, up 19% year over year to a 21% share.
It matters because China’s broader smartphone market fell 13% during the same period, its worst 618 showing in years, as rising memory costs forced manufacturers to scale back discounting industry-wide. Apple struggles with surging costs, as outlined in last week’s note, “Apple’s Component Cost Crunch - Is the Memory Shortage Finally Catching Up to Apple?”
What Apple’s Valuation and Fundamentals Are Really Signaling
Apple outperformed most Chinese rivals, including OPPO, vivo, Xiaomi, and HONOR, all of which posted double-digit declines, but does the persistent bullish sentiment miss underlying issues beneath the surface? Apple needed unusually deep discounts just to limit its own decline to single digits, but what happens once memory costs push prices higher again?
Metric | Value | Verdict |
P/E Ratio | 38.18 | Bearish |
P/B Ratio | 43.49 | Bearish |
PEG Ratio | 2.55 | Bearish |
Current Ratio | 1.07 | Bearish |
Return on Assets | 26.23% | Bullish |
Return on Equity | 141.47% | Bullish |
Profit Margin | 27.15% | Bullish |
ROIC-WACC Ratio | Positive | Bullish |
Dividend Yield | 0.34% | Bearish |
Apple Fundamental Analysis Snapshot
Price action has confirmed a horizontal resistance zone, and trading volumes have gradually decreased as shares inched higher, a trend traders should not dismiss. The Bull Bear Power Indicator is bullish, with a descending trendline and nearing a bearish crossover, but can it deliver the next technical bearish catalyst?
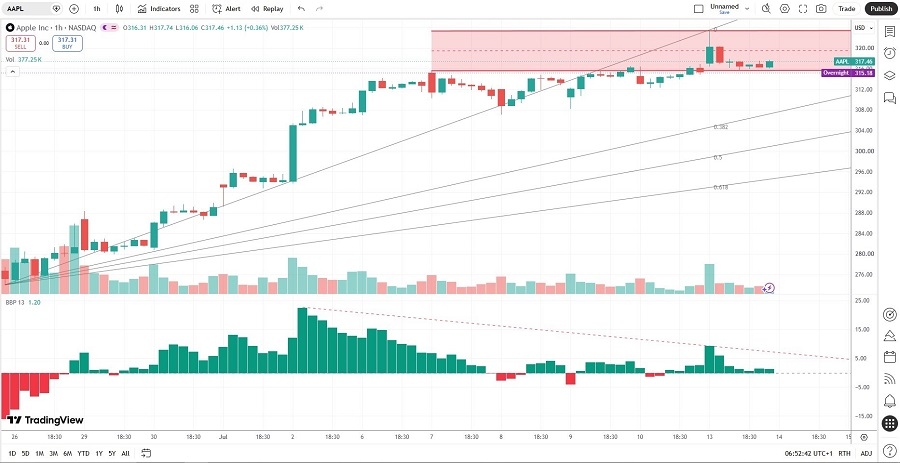
Apple Price Chart
The Hidden Risk Behind Ever-Deeper iPhone Discounts in China
Bulls may point to Apple’s smaller decline relative to Android rivals as proof of resilience, but the comparison masks an underlying issue. Apple discounted last year’s iPhone 16 even more aggressively, causing this year’s disappointment to stem from tougher comparisons rather than renewed enthusiasm for its product. Does that suggest underlying Chinese demand for iPhones is softer than headline market share gains imply?
Vendors and supply chain partners signal that higher prices could persist through 2026, and Apple’s Chinese smartphone shipments may post double-digit declines, following those of Chinese competitors. Since Apple must match or exceed this year’s discount depth simply to defend market share, margin pressure could compound just as memory costs are squeezing the entire industry. How will it impact component sourcing for the iPhone 18 lineup?
How Today’s Setup Reflects Shifting Market Sentiment on AAPL
The recent advance has taken price action to just above the average analyst price target of $316.76, suggesting no upside potential as downside risks and bearish catalysts accumulate. Is Wall Street underestimating how much further Apple may need to discount to defend its share as memory-driven price hikes spread across the industry?
China’s market is still shrinking, and Apple must rely on record discounting just to post a smaller decline than its competitors. Does it suggest that consensus estimates may be too optimistic heading into its next earnings release?
What Traders Should Watch Next in Apple’s Price Action
Price action trades between the 0.0% and 38.2% Fibonacci Retracement Fan levels. Can eroding China demand, masked by promotional intensity, become the catalyst that finally pressures Apple shares lower? Traders should consider the potential for a post-618 slowdown in China and how a breakdown below $307.05 could change the short-term narrative for shares near their 52-week high.
Ready to trade our analysis of Apple? Here is our list of the best stockbrokers worth reviewing.