


Top Regulated Brokers
What Are Nuclear Energy Stocks?
Nuclear energy stocks are publicly listed companies active in the nuclear energy sector. They primarily operate nuclear reactors to generate electricity. Alternatively, investors can participate in nuclear energy through uranium mining stocks.
Why Should You Consider Investing in Nuclear Energy Stocks?
Nuclear energy is a cornerstone of clean energy, and small modular reactors (SMRs) represent the industry’s most significant breakthrough. They can address the tremendous energy demand posed by data centers and AI. Forecasts estimate nuclear energy investment to exceed $2 trillion by 2050. With energy needs rising, energy security a national security concern for most countries, and the need to lower carbon emissions, nuclear energy has a bright future.
Here are a few things to consider when evaluating nuclear energy stocks:
Invest in nuclear energy stocks that have signed deals with some of the most notable end-users like tech giants Meta Platforms, Microsoft, Amazon, and Alphabet
Analyze next-generation nuclear energy stocks that can power the future with disruptive technologies, including nuclear fusion reactors
Mix your nuclear energy portfolio with established nuclear energy stocks, uranium miners, and next-generation players to diversify your exposure
What Are the Downsides of Nuclear Energy Stocks?
Uranium miners may struggle to meet demand, and uranium prices are volatile. Despite its clean energy appeal, opponents will try to derail or limit its potential due to concerns about nuclear waste and its environmental impact, which pose significant storage challenges. Nuclear energy experienced three major catastrophes: Chernobyl (1986), Three Mile Island (1979), and Fukushima (2011). Therefore, pushback against new nuclear reactors could delay deployment.
Here is a shortlist of attractive nuclear energy stocks:
Uranium Energy Corporation (UEC)
Lightbridge Corporation (LTBR)
Nano Nuclear Energy (NNE)
Standard Nuclear Corporation (STDN)
enCore Energy Corporation (EU)
An Update on Our Previous Best Nuclear Energy Stocks to Buy Now
In our previous installment, I highlighted the upside potential of Centrus Energy and Dominion Energy.
Centrus Energy (NYSE: LEU) - A long position in LEU between $158.16 and $169.91
LEU is up by over 6%, and I maintain my positions as originally outlined.
Dominion Energy (NYSE: D) - A long position in D between $68.41 and $69.85
D advanced over 2%, and I hold this position because I see the upside potential unchanged since I entered this trade.
Uranium Energy Corporation (NYSE: UEC) Fundamental Analysis
Uranium Energy Corporation (NYSE: UEC) focuses on in-situ recovery (ISR) operations across the US, benefiting from policies such as the CHIPS Act that favor local sourcing. It also holds significant physical uranium inventory and operates fully licensed processing facilities.
So, why am I bullish on Uranium Energy Corporation despite its 40%+ plunge?
Operations at the Burke Hollow project in Texas marked the first new in-situ recovery (ISR) uranium mine in the United States in over a decade, validating UEC’s hub-and-spoke model. The start of production at the header houses in Wellfield 11 at the company’s Christensen Ranch in Wyoming adds to my bullish outlook. Rising uranium prices and excellent liquidity provide a price floor.
Metric | Value | Verdict |
P/E Ratio | Unavailable | Bearish |
P/B Ratio | 3.45 | Bearish |
PEG Ratio | Unavailable | Bearish |
Current Ratio | 32.67 | Bullish |
Return on Assets | -6.24% | Bearish |
Return on Equity | -8.96% | Bearish |
Profit Margin | 0.00% | Bearish |
ROIC-WACC Ratio | Negative | Bearish |
Dividend Yield | 0.00% | Bearish |
Uranium Energy Corporation Fundamental Analysis Snapshot
The price-to-earnings (P/E) ratio for UEC is unavailable. By comparison, the P/E ratio for the S&P 500 is 28.60.
The average analyst price target for Uranium Energy Corporation is $18.03. It suggests excellent upside potential with acceptable downside risk.
Uranium Energy Corporation Technical Analysis
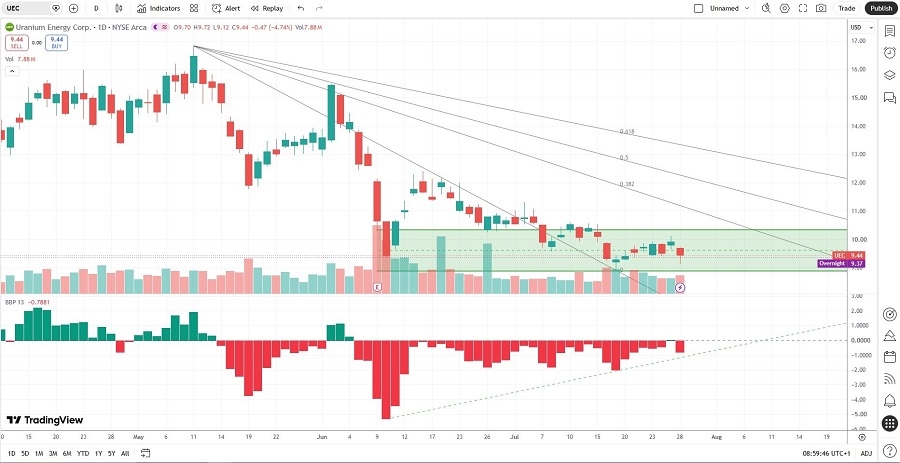
Uranium Energy Corporation Price Chart
The Uranium Energy Corporation D1 chart shows price action between its descending 0.0% and 38.2% Fibonacci Retracement Fan levels.
It also shows Uranium Energy Corporation inside a horizontal support zone.
The Bull Bear Power Indicator is bearish with an ascending trendline, nearing a bullish crossover.
My Uranium Energy Corporation Long Stock Trade
UEC Entry Level: Between $9.12 and $9.72
UEC Take Profit: Between $13.29 and $13.88
UEC Stop Loss: Between $7.13 and $7.70
Risk/Reward Ratio: 2.10
Lightbridge Corporation (NASDAQ: LTBR) Fundamental Analysis
Lightbridge Corporation (NASDAQ: LTBR) develops metallic nuclear fuel designed to replace traditional oxide fuel in existing Light Water Reactors (LWRs). It promises to increase power output by up to 10% and extend fuel cycles, offering immediate economic benefits to current reactor operators without requiring new plant construction.
So, why am I bullish on Lightbridge Corporation at current levels?
The Memorandum of Understanding (MoU) with Quadrant Nuclear Industries (QNI) to secure a domestic supply of High-Assay Low-Enriched Uranium (HALEU) from QNI’s planned Vanguard facility at Idaho National Laboratory drives my bullish narrative. The software integration with Studsvik to integrate its metallic fuel design into the CMS5 Core Management Suite will add a licensing revenue stream. At the same time, successful irradiation testing milestones and AI energy demand complete my bullish view.
Metric | Value | Verdict |
P/E Ratio | Unavailable | Bearish |
P/B Ratio | 1.21 | Bullish |
PEG Ratio | Unavailable | Bearish |
Current Ratio | 168.12 | Bullish |
Return on Assets | -11.62% | Bearish |
Return on Equity | -15.39% | Bearish |
Profit Margin | 0.00% | Bearish |
ROIC-WACC Ratio | Negative | Bearish |
Dividend Yield | 0.00% | Bearish |
Lightbridge Corporation Fundamental Analysis Snapshot
The price-to-earnings (P/E) ratio for LTBR is unavailable. By comparison, the P/E ratio for the S&P 500 is 28.60.
The average analyst price target for Lightbridge Corporation is $13.56. It suggests excellent upside potential with acceptable downside risk.
Lightbridge Corporation Technical Analysis
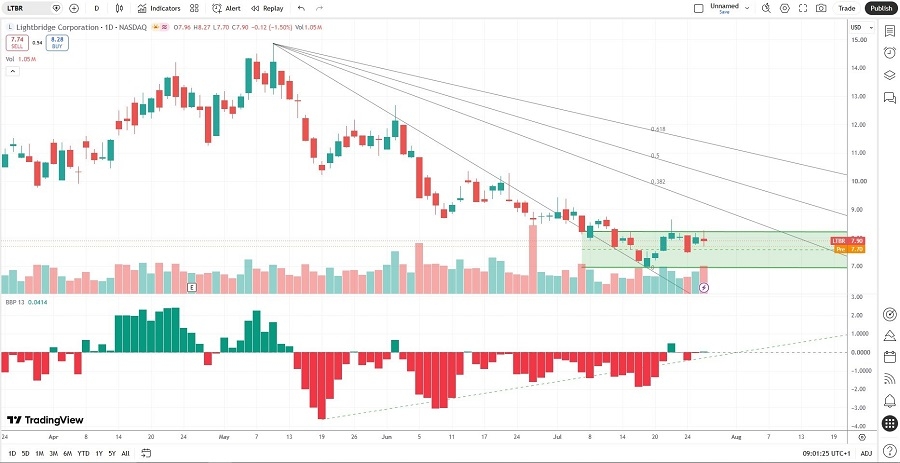
Lightbridge Corporation Price Chart
The Lightbridge Corporation D1 chart shows price action between its descending 0.0% and 38.2% Fibonacci Retracement Fan levels.
It also shows Lightbridge Corporation inside a horizontal support zone, nearing a breakout attempt.
The Bull Bear Power Indicator is bearish with a positive divergence, pending a bullish crossover.
My Lightbridge Corporation Long Stock Trade
LTBR Entry Level: Between $7.70 and $8.27
LTBR Take Profit: Between $10.92 and $11.60
LTBR Stop Loss: Between $6.10 and $6.55
Risk/Reward Ratio: 2.01
Ready to trade nuclear energy stocks and analysis? Here are the best CFD stocks brokers to choose from.