


Top Regulated Brokers
NVIDIA’s Custom Silicon Problem: Is the GPU Monopoly Under Attack?
NVIDIA (NASDAQ: NVDA) continues trading near record highs, despite its largest customers quietly becoming its most notable rivals. Google’s TPUs, Amazon’s Trainium, Microsoft’s Maia, and Meta’s MTIA are running AI workloads that once belonged exclusively to NVIDIA GPUs. Is Wall Street underestimating how much of NVIDIA’s growth runway depends on customers who are actively building their way out of its ecosystem?
Sentiment remains bullish on paper, but does rising hyperscaler capex directed at custom silicon rather than GPUs change the quality of NVIDIA’s future revenue?
Why Custom Chips Threaten NVIDIA’s Core Economics
Hyperscalers are shifting spending toward application-specific chips that cut compute costs by wide margins compared with general-purpose GPUs. This year’s combined hyperscaler AI capex is projected between $660 billion and $ 690 billion, and Broadcom (NASDAQ: AVGO) and Marvell (NASDAQ: MRVL) are becoming direct beneficiaries of the NVIDIA exodus. It adds to worries about NVIDIA’s role in China, as outlined in last week’s note, “NVIDIA’s China Market Share Collapses: Is a $5 Trillion Valuation Ignoring the Damage?”
The list of chips displacing NVIDIA workloads keeps growing. OpenAI is reportedly developing custom silicon with Broadcom even as it maintains a massive NVIDIA GPU commitment, and Anthropic has expanded multi-gigawatt TPU deployments alongside its own compute needs, while signing a massive deal with AMD (NASDAQ: AMD).
Core NVIDIA Fundamental and Technical Facts to Consider
NVIDIA dominates flexible training workloads, but inference has become the majority of AI compute. Is NVIDIA's CUDA software a little too late and too insignificant? Every significant AI lab began hedging against reliance on a single supplier. Does that diversification trend erode the pricing power that NVIDIA has enjoyed as the default choice?
Metric | Value | Verdict |
P/E Ratio | 31.75 | Bearish |
P/B Ratio | 25.69 | Bearish |
PEG Ratio | 0.57 | Bullish |
Current Ratio | 3.44 | Bullish |
Return on Assets | 52.73% | Bullish |
Return on Equity | 114.29% | Bullish |
Profit Margin | 62.97% | Bullish |
ROIC-WACC Ratio | Positive | Bullish |
Dividend Yield | 0.48% | Bearish |
NVIDIA Fundamental Analysis Snapshot
Price action recovered into its horizontal resistance zone, but bears appear to put up a fight. The Bull Bear Power Indicator is bullish, but a descending trendline is pressuring it close to a bearish crossover, which is a possibility traders should keep an eye out for.
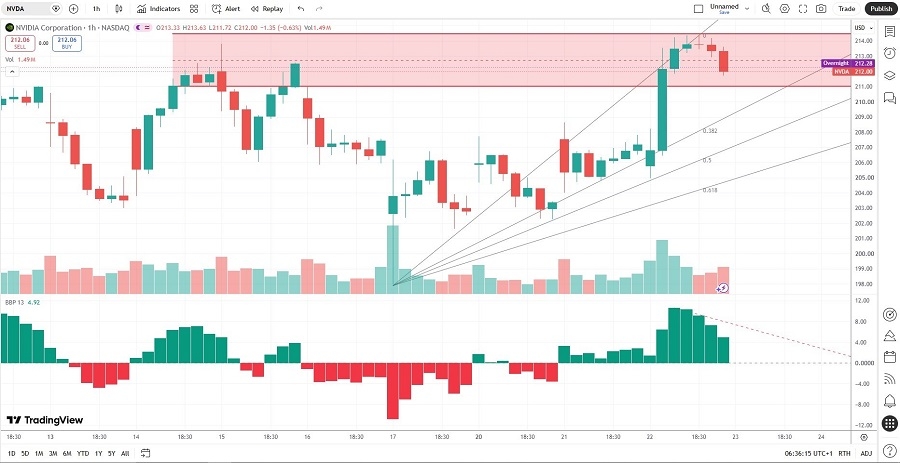
NVIDIA Price Chart
Where Bulls Push Back and Why It May Not Hold
Bulls note that GPUs still account for the majority of AWS’s AI server build-out, and NVIDIA’s upcoming Rubin platform aims to reclaim the performance lead with HBM4 memory. These are valid points, and NVIDIA also maintains a “Strong Buy” rating from most of the 61 analysts covering it. Still, is Wall Street’s continued optimism justified?
Bears counter that each time a hyperscaler moves a production workload onto its own chips, NVIDIA’s narrative weakens. While bulls appear to ignore custom-chip deployments at some of its biggest customers, this reflects a significant structural risk that slowly compresses NVIDIA’s gross margins and erodes its market share. As hyperscalers diversify away from single-vendor dependence, what does this mean for NVIDIA’s value proposition?
What the Setup Signals About Market Sentiment
Despite rising bearish catalysts, the average analyst price target of $302.83 suggests good upside potential, but downside risk is accelerating faster. Is NVIDIA losing its competitive edge faster than it can produce next-gen technology?
Options markets show implied volatility well ahead of its 30-day average, with straddle pricing implying a swing near 6% around the next earnings release. What does that gap between analyst optimism and options market caution suggest relative to the average analyst price target?
What the Setup Signals About Market Sentiment
Will NVIDIA’s upcoming architecture cycle be enough to reverse hyperscalers’ silicon ambitions? Today’s session could see a breakdown that clears more downside, or will bulls defend $211.06?
My NVDA Short Trade for Today’s Trading Session
NVDA Entry Level: Between $211.72 and $214.37
NVDA Take Profit: Between $197.97 and $203.00
NVDA Stop Loss: Between $218.18 and $221.01
Risk/Reward Ratio: 2.13
Ready to trade our stock market forecast and analysis? Here are the best CFD stocks brokers to choose from