


The Walt Disney Company (NYSE: DIS) released its fiscal third-quarter results before yesterday's opening bell. While it beat adjusted earnings, which bulls took and ran with, the underlying fundamentals paint a different picture. Did Wall Street celebrate the wrong numbers?
Yesterday’s rally came from one-off items and cost cuts rather than a headline beat. ESPN stands out as its programming bill rises each season. How long can theme parks and streaming cover sports?
Top Regulated Brokers
Why ESPN’s Cost Spiral Overshadows the Celebration
Bulls cheered yesterday, but revenue missed consensus, GAAP net income roughly halved, and Disney’s sports business occupies an awkward position within the empire, delivering another quarter of shrinking profits despite being America’s most powerful sports media brand. Still, escalating rights fees have increased operating costs regardless of audience behavior. How much more will investors tolerate this drag?
Shareholders might be frustrated with how management is handling ESPN, as engagement is not the issue, as evidenced by record playoff audiences. At the same time, the segment shows profitability trending in the wrong direction. Disney is spending more each year to defend its market position, but will distribution gains outpace this kind of cost inflation?
Core Disney Fundamental and Technical Facts to Consider
While revenue rose 7% year-over-year to $25.25 billion, it continued its pattern of missing estimates. GAAP net income fell to $2.64 billion, or $1.51 per share, from $5.26 billion, or $2.92, a year earlier. ESPN operating income dropped 17% to $853 million despite a 4% increase in revenue to $4.5 billion. Is the cost curve steepening faster than Disney admits?
Metric | Value | Verdict |
P/E Ratio | 15.70 | Bullish |
P/B Ratio | 1.57 | Bullish |
PEG Ratio | 2.29 | Bearish |
Current Ratio | 0.68 | Bearish |
Return on Assets | 4.45% | Bearish |
Return on Equity | 11.01% | Bullish |
Profit Margin | 11.54% | Bullish |
ROIC-WACC Ratio | Negative | Bearish |
Dividend Yield | 1.53% | Bearish |
Disney Fundamental Analysis Snapshot
Price action has formed a horizontal resistance zone, with surging bearish trading volumes. The Bull Bear Power Indicator is bullish, but a descending trendline is pushing it toward a potential bearish crossover. Are the bulls running out of steam?
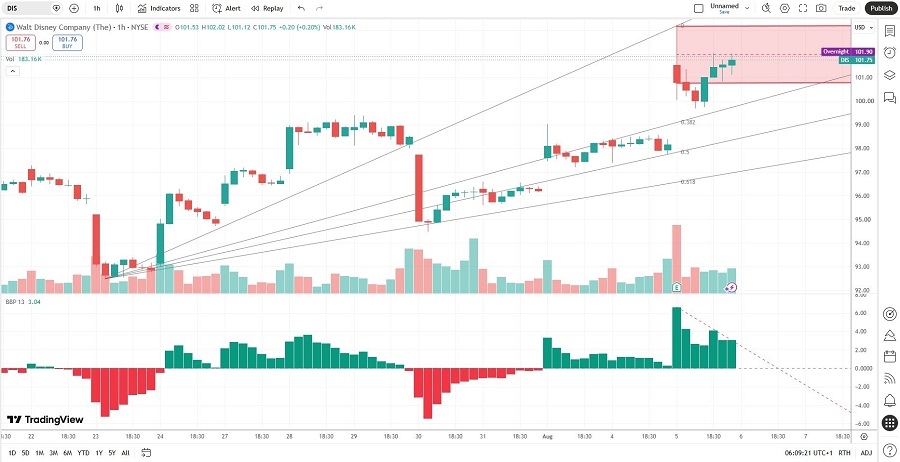
Disney Price Chart
Where Bulls Push Back and Why It May Not Be Enough
Bulls highlight strength in the Experiences segment, which includes theme parks, where revenue climbed 10% to $9.97 billion, while Toy Story 5 powered the studio, and streaming was a net contributor. To calm discontent, Disney increased its 2026 share repurchase program to at least $9 billion, aided by its $1.2 billion A+E divestiture and a $100 million tariff refund. Is management hiding something with its buyback plan?
Bears argue that asset sales, repurchases, and refunds provide a finite source of one-time contributors, while sports cost inflation recurs each season. Unless Disney finds a way to reverse the trend, ESPN could continue to decrease earnings quality. How many quarters can financial engineering paper over segment weakness?
What the Setup Signals About Market Sentiment
The average analyst price target of $126.51 suggests good potential, but downside risk is rising faster. Citi was the first to trim its price target, and shares are nearing bear market territory. How will Disney handle another downgrade?
Options traders priced an implied post-earnings move of roughly 5.5%, which never materialized in either direction. Still, the premium signals caution, and that could have a material impact on price action. Was yesterday’s advance a precursor for bears to step in and take over?
What’s Next for Disney’s Price Action?
What happens to Disney when the buyback tailwind slows while it bleeds ESPN? Today’s session could reverse yesterday’s post-earnings move, but what might happen above $104.52?
My DIS Short Trade for Today’s Trading Session
DIS Entry Level: Between $100.79 and $103.21
DIS Take Profit: Between $86.77 and $89.61
DIS Stop Loss: Between $107.12 and $110.48
Risk/Reward Ratio: 2.22
Ready to trade our Walt Disney forecast and analysis? Here are the best CFD stocks brokers to choose from.