


MetLife (NYSE: MET) will report its second-quarter results after Wednesday’s close. Bulls have been pushing shares to an all-time high, but fundamental developments point in a different direction. Wall Street revenue and EPS expectations have set a high bar for MetLife to meet, but how will forward guidance factor in?
While MetLife guided variable investment income between $220 million and $270 million, do investors misprice what this means?
Top Regulated Brokers
Why the Investment Income Warning Deserves Attention
After MetLife guided variable investment income for full-year 2026 at roughly $1.6 billion, it achieved between $475 million and $525 million in the first quarter. Second-quarter guidance runs at 50% of the rate, while private equity, real estate funds, and prepayment fees decrease as rate expectations shift. With shares just shy of their all-time highs, how will the second quarter impact sentiment after the release?
Since MetLife’s earnings quality leans heavily on investment spreads, bears correctly note that spread income tracks the curve rather than management execution, making it a structural vulnerability. As new-money yields soften while MetLife took on a riskier commercial mortgage book, the combined risk is greater than shares suggest. Does MetLife deserve its current multiple?
Core MetLife Fundamentals and Technical Facts to Consider
MetLife has a revenue problem, as evidenced by the first quarter’s meager 1.3% year-over-year increase that missed expectations. Net premiums fell 6.4% to $12.12 billion, following the fourth quarter’s revenue miss, while five-year annualized revenue growth is a disappointing 3.2%. Where will the expected 7.9% revenue growth come from? Book value decreased to $37.92, reminding investors of rate and mark-to-market swings.
Metric | Value | Verdict |
P/E Ratio | 18.63 | Bearish |
P/B Ratio | 2.26 | Bearish |
PEG Ratio | 0.51 | Bullish |
Current Ratio | 2.09 | Bullish |
Return on Assets | 0.45% | Bearish |
Return on Equity | 13.01% | Bullish |
Profit Margin | 4.66% | Bearish |
ROIC-WACC Ratio | Negative | Bearish |
Dividend Yield | 2.47% | Bullish |
MetLife Fundamental Analysis Snapshot
Price action broke down below a horizontal resistance zone and below its ascending Fibonacci Retracement Fan, with bearish trading volumes rising. The Bull Bear Power Indicator also turned bearish with a descending trendline.
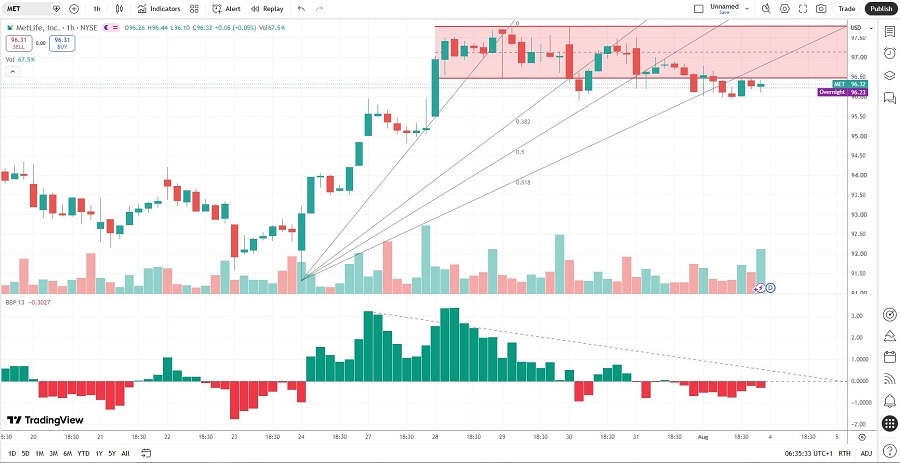
MetLife Price Chart
Where Bulls Push Back and Why It May Not Be Enough
Bulls justify the push to record highs with an adjusted return on equity of 17%, at the top of the 15% to 17% range. They equally point to a 4.4% dividend increase to $0.5925 per share, $755 million of first-quarter buybacks, and a record pension risk transfer quarter. It prompted price target upgrades by Keefe Bruyette and UBS to $105, while Jefferies expects $103 and Mizuho $102.
Bears rightly question where the upside would come from with current prices near the average consensus price target of $97.75, while Bank of America already trimmed its target to $103. Will more price target cuts follow the release of second-quarter earnings?
What Today’s Setup Signals About Sentiment
The average price target of $97.75 suggests negligible upside potential, while downside risks have risen materially. Bulls already rallied behind the earnings release as if an upbeat report and guidance are guaranteed. What is the margin for error with shares at current levels?
Options positioning shows complacency with open interest clusters in near-dated calls around the $95 and $100 strikes, and put activity thins out below $90. Also, implied volatility is subdued heading into the earnings release, suggesting traders expect a contained post-earnings move. What will happen if revenue disappoints for a third consecutive quarter?
What’s Next for MetLife’s Price Action?
The EPS-beat and revenue-miss pattern has triggered post-earnings sell-offs twice. Will a stock at record highs forgive a third? Today’s session could extend the breakdown, but what happens above $97.80?
My MET Short Trade Into the Earnings Release
MET Entry Level: Between $95.95 and $96.79
MET Take Profit: Between $84.23 and $85.39
MET Stop Loss: Between $100.73 and $102.75
Risk/Reward Ratio: 2.45
Ready to trade our MetLife forecast and analysis? Here are the best CFD stocks brokers to choose from.