


NVIDIA (NASDAQ: NVDA) is heading toward its crucial August 26 earnings report under a cloud that has little to do with chip performance. Reports suggest that the company continues to engage in business practices that resemble circular financing. What is NVIDIA hiding beneath the surface?
When the world’s most valuable chipmaker becomes its biggest customer’s financial backer, how much of the demand on NVIDIA’s books is truly organic?
Top Regulated Brokers
Why Circular Financing and OpenAI Exposure Might Be an Issue for NVIDIA’s Story
NVIDIA is weighing a $250 billion guarantee for OpenAI’s data-center leases and roughly $350 billion in chip-purchase financing, continuing to finance its largest customers, which draws comparisons to previous industry behemoths who collapsed by doing the same. Therefore, reported demand can overstate underlying end-market demand, and concentration risks grow. It magnifies the issues outlined in our previous note, “NVIDIA’s Custom Silicon Problem: Is the GPU Monopoly Under Attack?”
Investors should consider how an unprofitable core customer, leveraged data centers, and intertwined balance sheets can create stress at one node that ripples across the entire ecosystem. While bulls call NVIDIA’s circular financing a way to accelerate the AI buildout, what if funding stress reveals mispriced risk?
Key NVIDIA Fundamental and Valuation Facts to Watch Today
The $600 billion OpenAI package is the largest single AI infrastructure commitment ever. In the meantime, NVIDIA’s credit default swap premiums have climbed, and insiders have sold more than $400 million of stock in recent months. Export control tightening adds another overhang, as NVIDIA has generated no revenue from approved H200 shipments because Beijing discourages imports. Which issue can break the recent rally, if any?
Metric | Value | Verdict |
P/E Ratio | 34.24 | Bearish |
P/B Ratio | 27.75 | Bearish |
PEG Ratio | 0.62 | Bullish |
Current Ratio | 3.44 | Bullish |
Return on Assets | 52.73% | Bullish |
Return on Equity | 114.29% | Bullish |
Profit Margin | 62.97% | Bullish |
ROIC-WACC Ratio | Positive | Bullish |
Dividend Yield | 0.45% | Bearish |
NVIDIA Fundamental Analysis Snapshot
Price action is challenging the upper band of its horizontal resistance zone, but average bearish trading volumes are higher than average bullish trading volumes. The Bull Bear Power Indicator is bullish, with a descending trendline. Is a bearish crossover next?
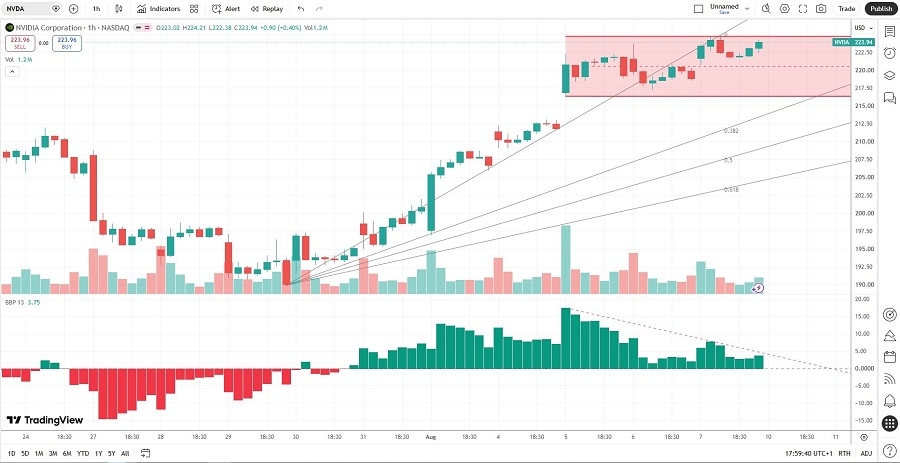
NVIDIA Price Chart
Where Bears Push Back and Why It May Not Hold
Bulls clamor to CEO Jensen Huang and his dismissal of circular financing accusations, calling them preposterous. He added that NVIDIA’s investments represent only a small fraction of customers’ total financing, but how small is the $600 billion OpenAI bundle in reality? While NVIDIA grew fiscal 2026 revenue by 65% to $215.9 billion, how much of that was from lending money to its customers to inflate revenue?
Bears counter that NVIDIA cannot separate organic hyperscaler demand from vendor-financed demand. It guarantees a quiet conversion from an equity story into a credit story. If OpenAI’s monetization stumbles, how does this impact NVIDIA in terms of orders and liabilities?
What Today’s Setup Highlights About Market Sentiment
The average price target of $302.83 indicates excellent upside potential, but downside risk is accelerating rapidly. Another underappreciated risk is the gap between analyst optimism and credit-market caution. Is Wall Street too slow to reprice the risk embedded in NVIDIA’s circular financing web?
Options markets reflect underlying nervousness. The put/call volume ratio is near 0.83, well above its typical level around 0.56, signaling demand for downside protection. Implied volatility near 44% ahead of its next earnings release hints at above-average volatility. Will bulls get caught off-guard?
What’s Next for Alphabet’s AI-Driven Story
How will the OpenAI commitments and China outlook impact headline risk going into its late-August earnings release? Today’s session could pierce the horizontal resistance zone, but what if bulls retake $227.39?
My NVDA Short Trade for the Current Setup
NVDA Entry Level: Between $220.67 and $224.76
NVDA Take Profit: Between $196.90 and $201.63
NVDA Stop Loss: Between $232.28 and $236.54
Risk/Reward Ratio: 2.05
Ready to trade our stock market forecast and analysis? Here are the best CFD stocks brokers to choose from.