


Paycom Software (NYSE: PAYC) will report second-quarter results after Wednesday’s close. After bulls have taken control of price action over the past five weeks, bears are raising the right questions ahead of earnings. Has the five-week rally outpaced Paycom, and what might it deliver against a challenging backdrop?
Consensus estimates for Wednesday resemble the slowest pace in the company’s history as a publicly traded company. Does recent price action make sense against a decelerating top line?
Top Regulated Brokers
Why Competitive Pressure Is the Real Story
ADP, Paychex, Workday, and Paylocity are Paycom's core competitors, but newcomers like Rippling and Gusto have also started to take market share away from Paycom. Since the mid-market is a crowded field, aggressive pricing has become the weapon of choice to win customers. Therefore, legacy players decided to play offense to defend market share, but where does that leave investors?
Paycom’s revenue growth trend line confirms the strain. Over the past two years, annualized revenue growth was 10.1%, compared with its five-year growth rate of 19.5%. Paycom guided 2026 revenue growth between 6% and 7% versus the 9% achieved in 2025. Shares rallied as growth rates decreased, but what do bulls expect for the second half?
Core Paycom Fundamentals and Technical Facts to Consider
The softening labor market has increased forward guidance risk, as Paycom bills per employee per month. Therefore, hiring freezes and layoffs impact transaction volumes immediately. Paycom guides 2026 interest on funds held for clients at roughly $103 million, down from $113 million, amid lower rates that compress margins. While management reaffirmed its guidance in May, what will happen if this metric dips below $100 million?
Metric | Value | Verdict |
P/E Ratio | 19.52 | Bearish |
P/B Ratio | 9.42 | Bearish |
PEG Ratio | 1.18 | Bullish |
Current Ratio | 1.08 | Bearish |
Return on Assets | 7.88% | Bearish |
Return on Equity | 37.15% | Bullish |
Profit Margin | 22.44% | Bullish |
ROIC-WACC Ratio | Positive | Bullish |
Dividend Yield | 0.91% | Bearish |
Paycom Fundamental Analysis Snapshot
Price action trades inside of a horizontal resistance zone and is pending a complete breakdown below its ascending Fibonacci Retracement Fan. Still, bullish trading volumes are high, and the Bull Bear Power Indicator is bullish, but with a descending trendline.
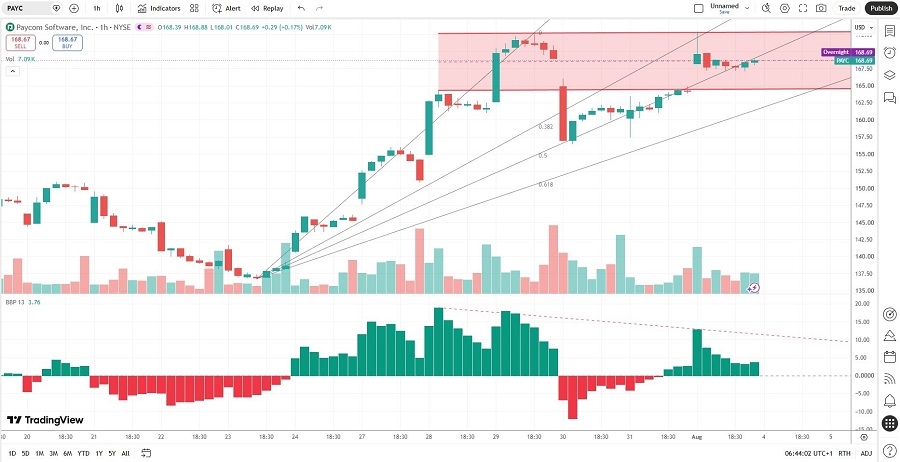
Paycom Price Chart
Where Bulls Push Back and Why It May Not Be Enough
Bulls hinge their rally on a solid first quarter, where revenues rose 8% with an adjusted EBITDA margin of 48.2%, and free cash flow of $183 million. Also, Paycom beat the $2.99 EPS estimate, reporting $3.15. While this is a backward-looking driver, bulls also rightly hint at AI tools like Beti, GONE, and IWant that drive client engagement. Is the good news already priced in?
Bears counter that first-quarter revenues still missed estimates, while Paycom repurchased 8.38 million shares for $1.07 billion during the quarter. It represented roughly 15% of the float, partly funded by $675 million drawn on a credit facility, which shrank shareholders’ equity by $812 million. Did bulls confuse shrinking share count with earnings growth?
What Today’s Setup Signals About Sentiment
The average price target of $151.50 suggests that price action has already overshot the consensus, despite a notable rise in downside risks. The most recent price target increase still lands below the current share price, while some models suggest a zero chance of an earnings beat. Have bulls outrun the results?
Options positioning hints at aggressive double-digit moves following the earnings release. Open interest has built in near-dated calls around the $170 and $180 strikes, while put activity thins out below $150 and implied volatility is well above typical levels. Are bears gearing up to take control?
What’s Next for Paycom’s Price Action?
Shares gapped higher twice in the final week of July without company-specific news, so is a reversal pending? Today’s session might test its horizontal resistance zone, but what happens at the 61.8% Fibonacci Retracement Fan level?
My PAYC Short Trade into the Earnings Release
PAYC Entry Level: Between $166.05 and $172.71
PAYC Take Profit: Between $136.85 and $140.53
PAYC Stop Loss: Between $177.89 and $181.45
Risk/Reward Ratio: 2.47
Ready to trade our Paycom forecast and analysis? Here are the best CFD stocks brokers to choose from.